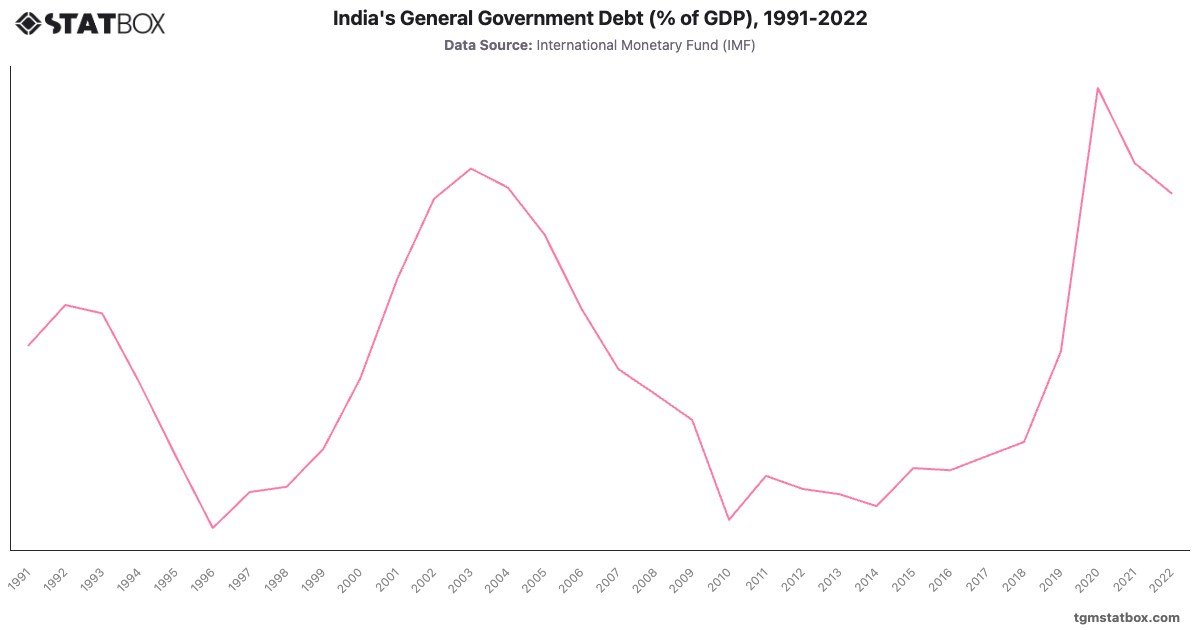
India’s debt ratio was high at the start of the 1990s, reaching in 1991 amid an economic crisis that led to significant fiscal reforms. By 1995, India had brought down its debt to with these reforms and continued efforts to stabilize. However, public debt started increasing again in the 2000s, peaking at in 2003 due to high infrastructure spending and social programs.
While India managed to reduce debt moderately in the late 2000s, reaching in 2010, levels gradually increased again, reaching in 2020 due to the economic fallout from COVID-19. By 2022, India’s debt ratio remained elevated at as economic recovery continued amidst fiscal challenges.
While India managed to reduce debt moderately in the late 2000s, reaching in 2010, levels gradually increased again, reaching in 2020 due to the economic fallout from COVID-19. By 2022, India’s debt ratio remained elevated at as economic recovery continued amidst fiscal challenges.
Explore related charts to gain a better understanding of industry sector’s GDP share in India, India’s central government debt ratio, India’s annual GDP growth rate.