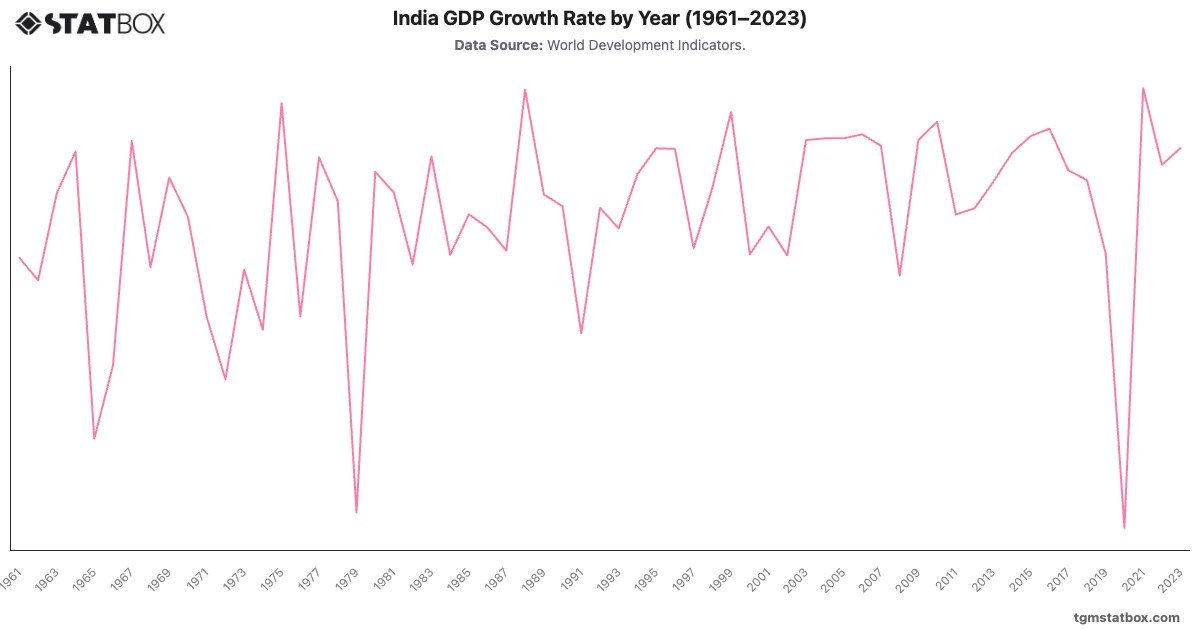
India GDP Growth Rate by Year (1961–2023)

India GDP Growth Rate by Year (1961–2023)

Unlock this statistic

Log in to unlock

No account? Sign up free

Insights

Key Takeaways

India GDP Growth (1961-2023)

India's economic growth trajectory from 1961 to 2023 highlights key periods of expansion and contraction. The liberalization reforms in the early 1990s set the stage for a decade of growth, reaching in 1999. The mid-2000s brought consistent expansion, peaking at in 2010 due to infrastructure development and rising consumption. However, 2020 marked a sharp decline of - due to the pandemic, but India quickly rebounded, recording growth in 2021. By 2023, the GDP growth rate stabilized at , driven by continued industrial and digital sector growth.

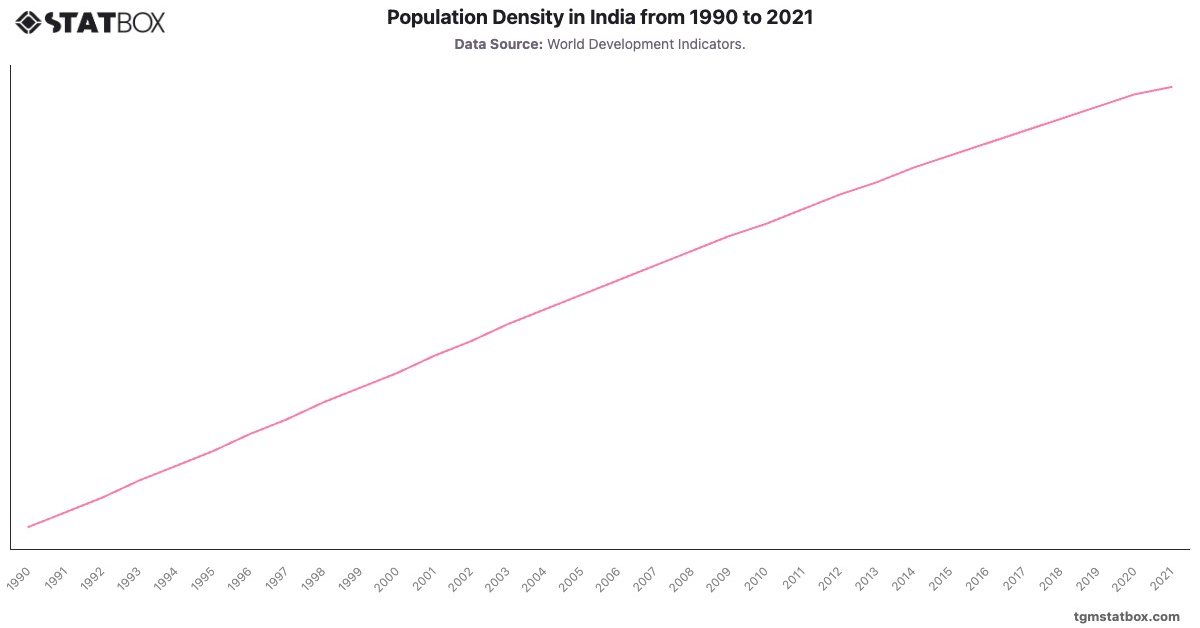
Gain a broader perspective by reviewing India’s population density, India’s unemployment rate trend, India’s population figures.

Would you like to know more?
Check our report on this topic

Sustainability Report: Insights in India

India Sustainability Insights Report 2024

Sustainability Report: Insights in India

Discover how people in India think and act on sustainability. TGM delivers localized, data-driven insights to support responsible business decisions and global impact.

Go to report

Further Recommended Statistics

Statbox vector
Statbox |form contact icon

Have Other Queries?

Statbox vector

Connect with our expert team for immediate assistance or comprehensive market analysis. We are always ready to support your business needs.