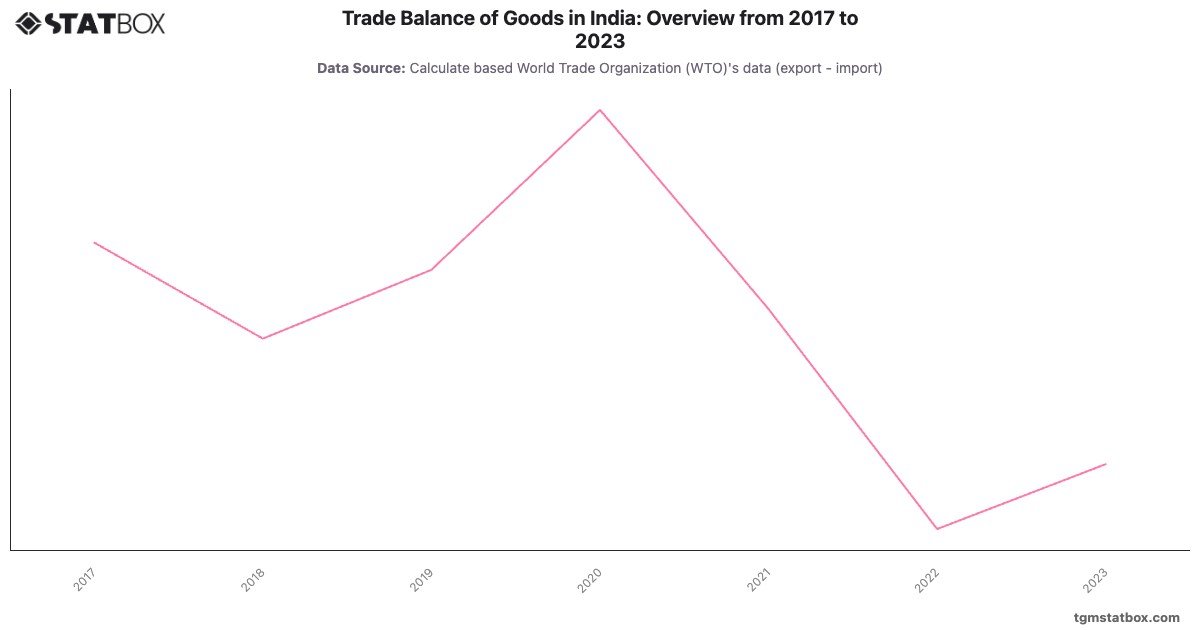
India consistently recorded substantial trade deficits from 2017 to 2023, with the deficit widening from -150,684.0 million USD in 2017 to a peak of -267,026.3 million USD in 2022. This increase was driven by high import dependency for crude oil, electronics, and gold, alongside a growing domestic demand for consumer goods.
In 2023, the deficit narrowed slightly to -240,666.3 million USD, reflecting moderation in global energy prices and export growth in IT, textiles, and pharmaceutical sectors. However, India’s trade dynamics underscore the challenges of a large import-reliant economy and the need for policies promoting export diversification and energy self-sufficiency.
In 2023, the deficit narrowed slightly to -240,666.3 million USD, reflecting moderation in global energy prices and export growth in IT, textiles, and pharmaceutical sectors. However, India’s trade dynamics underscore the challenges of a large import-reliant economy and the need for policies promoting export diversification and energy self-sufficiency.
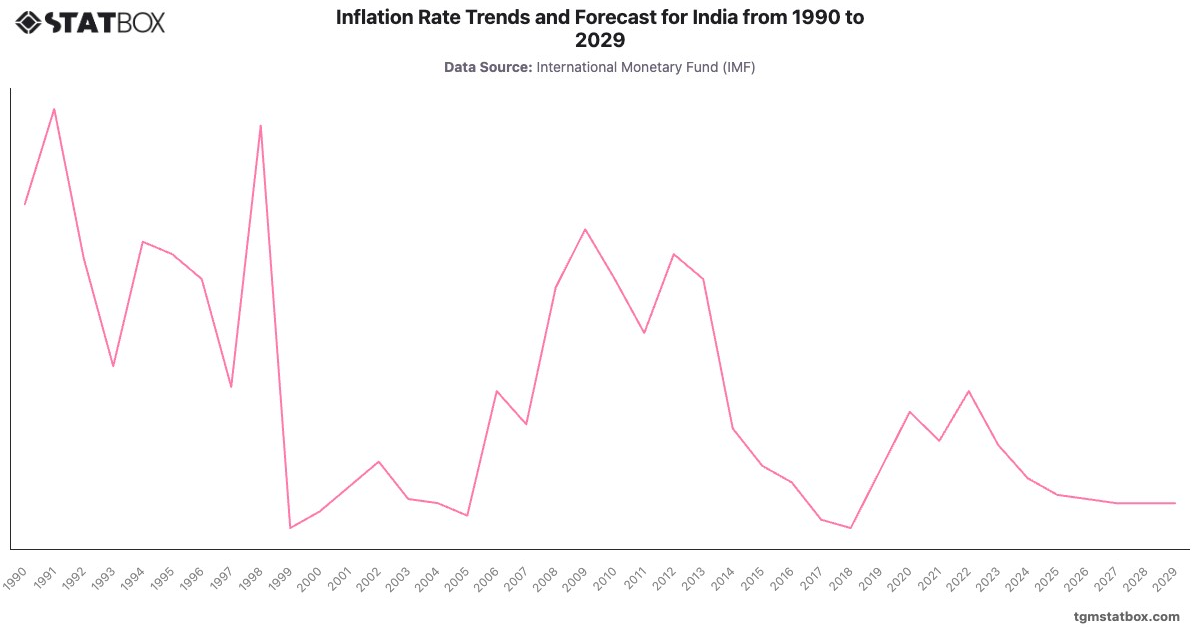
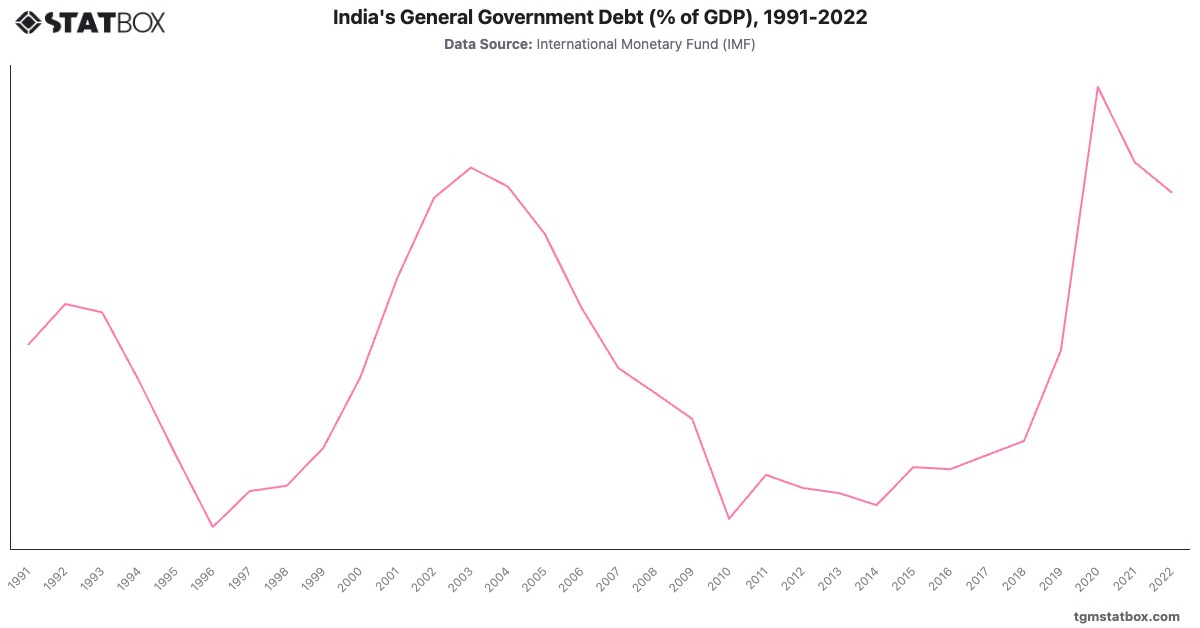
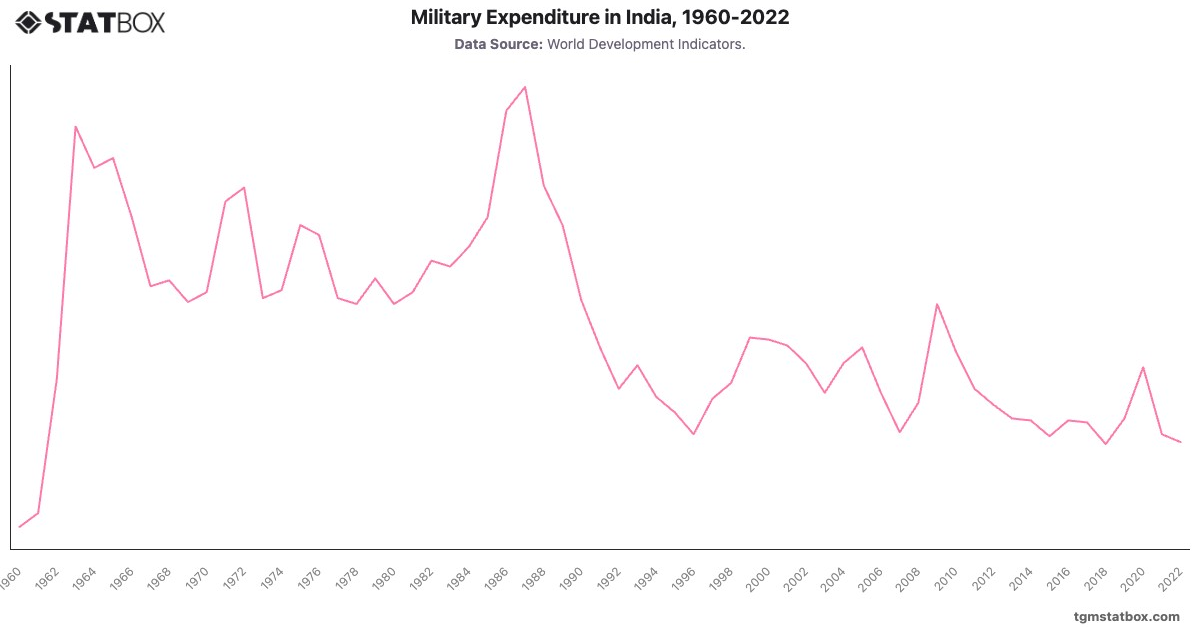
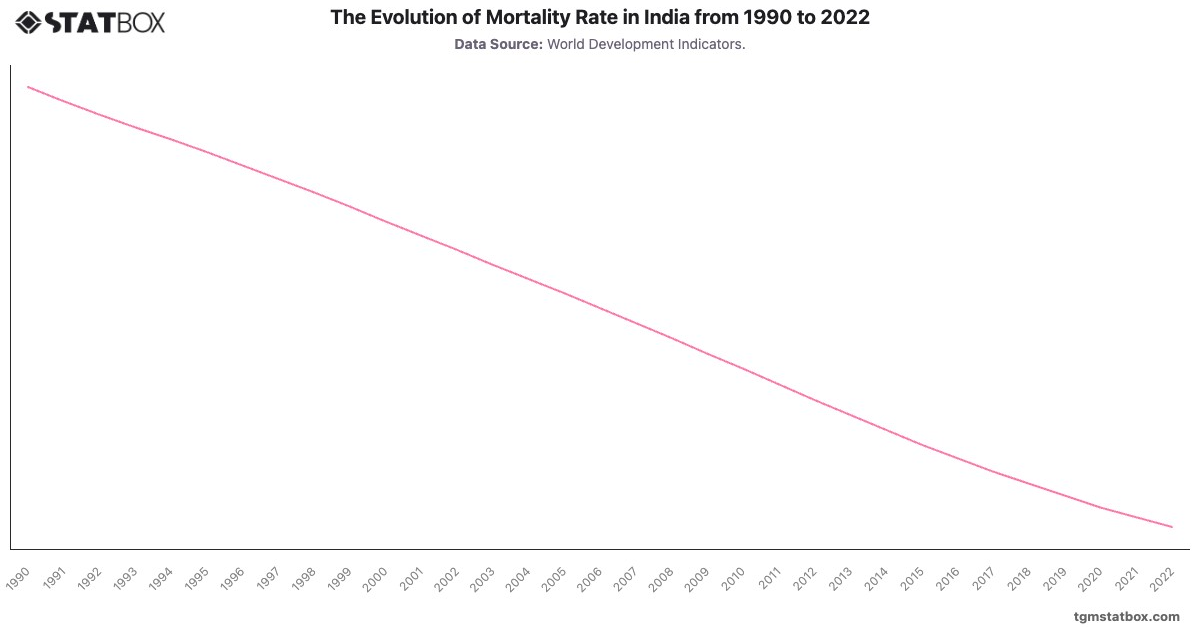
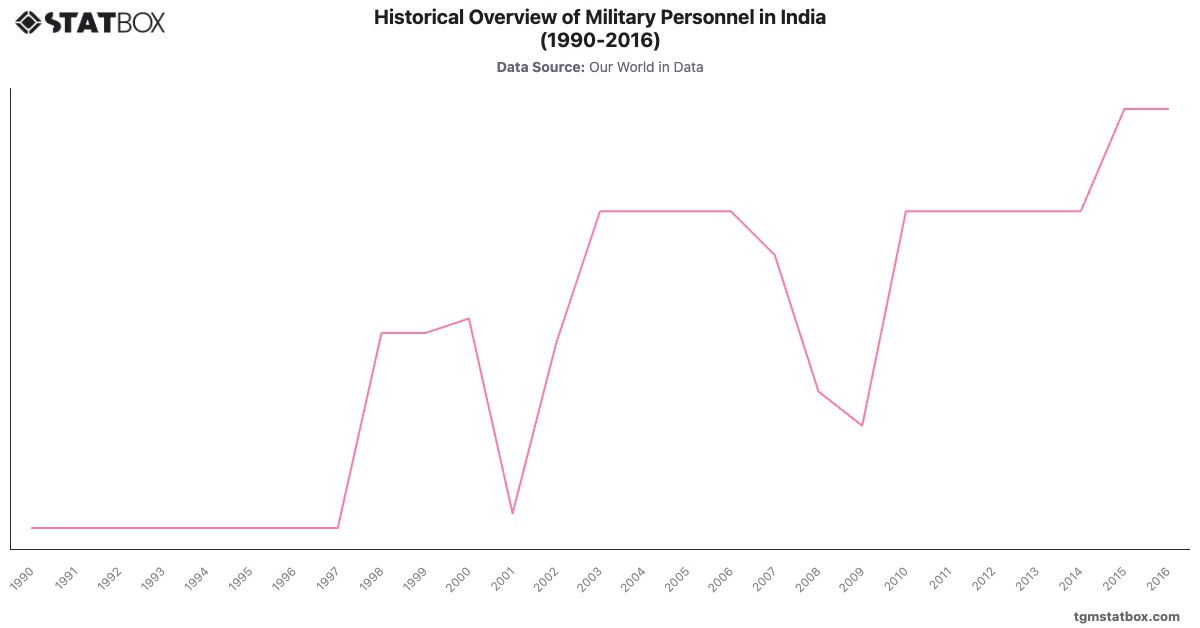
Explore related charts to gain a better understanding of India’s net ODA annual share, India’s population density, India’s military personnel statistics.