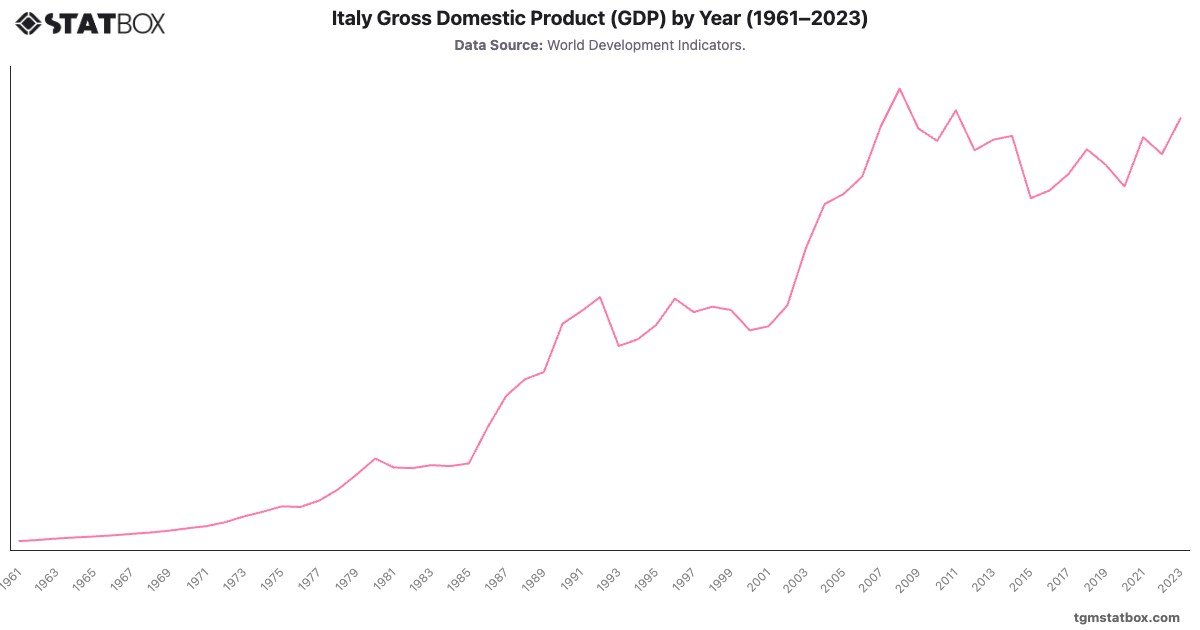
Italy's GDP reflects its post-war economic miracle and subsequent fluctuations tied to global and domestic factors. From $46.5 billion in 1961, GDP grew rapidly during the 1960s and 1970s, reaching $227.7 billion in 1975. This growth was driven by industrialization, strong exports, and a burgeoning manufacturing sector. The 1980s continued the upward trend, peaking at $1.18 trillion in 1990, supported by robust trade and integration into the European market.
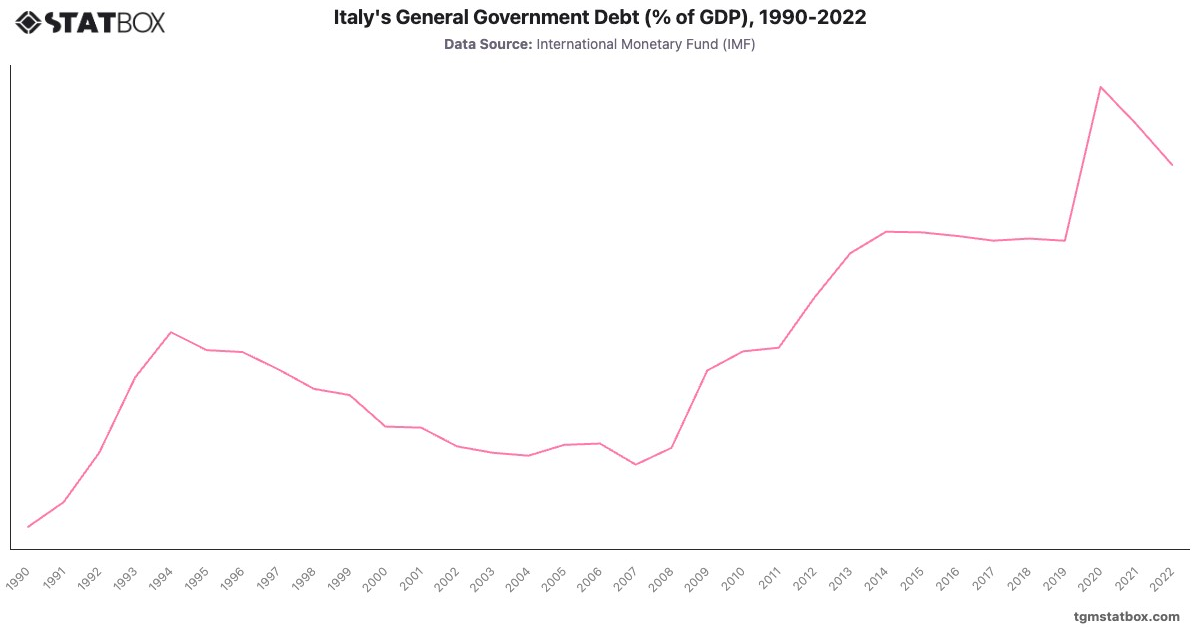
The 2008 global financial crisis led to a contraction, with GDP declining from $2.4 trillion in 2008 to $1.8 trillion by 2015. However, Italy's diversified economy and recovery efforts saw GDP rebound to $2.25 trillion in 2023, supported by tourism, exports, and investments in green energy and digital infrastructure.
The 2008 global financial crisis led to a contraction, with GDP declining from $2.4 trillion in 2008 to $1.8 trillion by 2015. However, Italy's diversified economy and recovery efforts saw GDP rebound to $2.25 trillion in 2023, supported by tourism, exports, and investments in green energy and digital infrastructure.
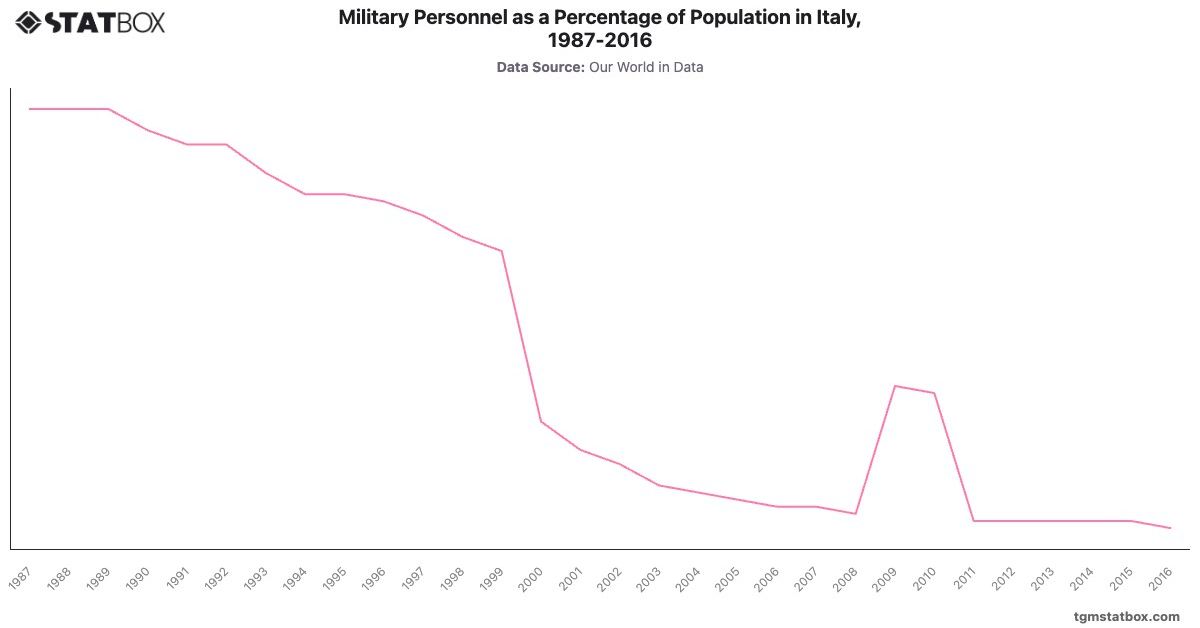
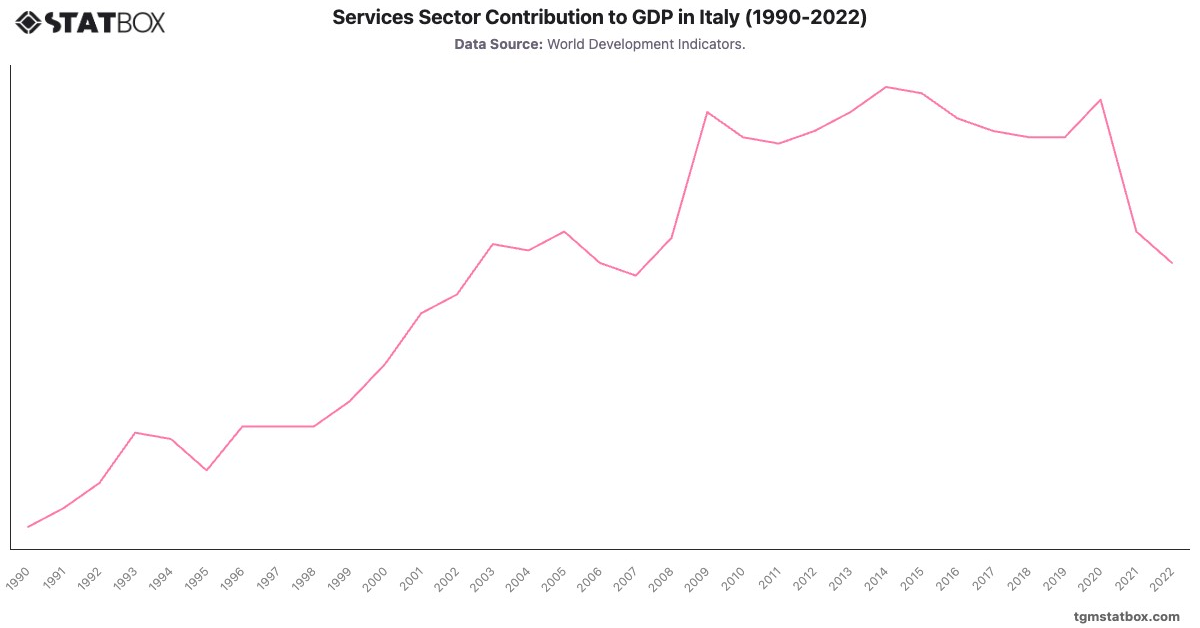
Find out more through related statistics on Italy’s industry sector share in GDP, Italy’s military personnel proportion, Italy’s manufacturing share in GDP.