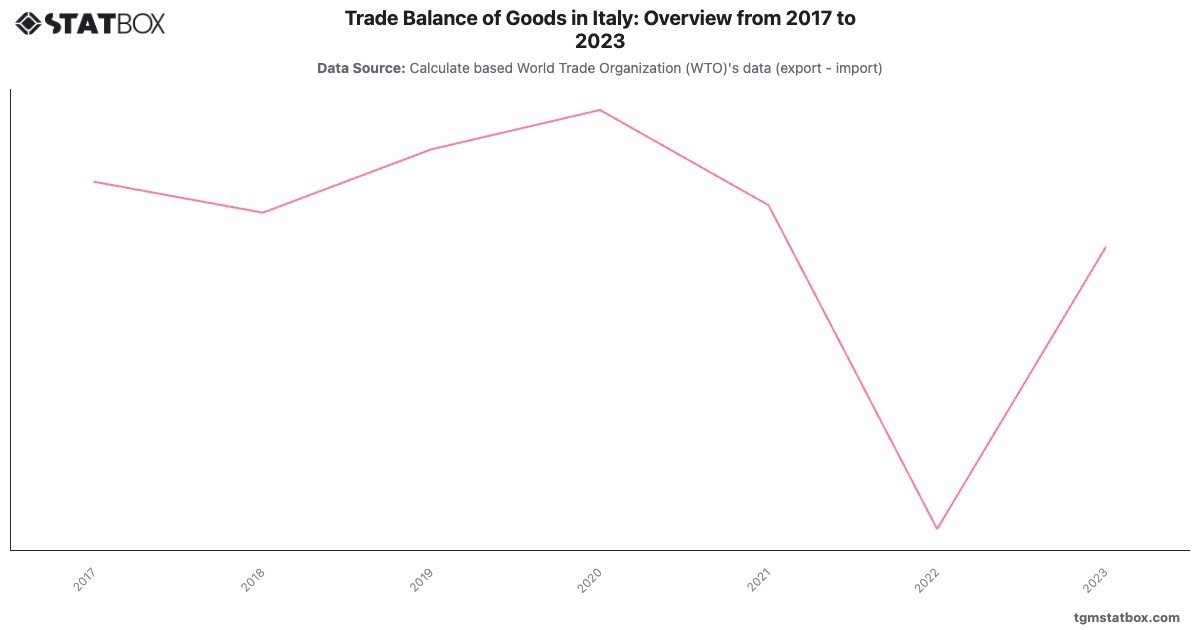
Italy’s trade balance experienced considerable fluctuations, moving from a surplus of 54,295.5 million USD in 2017 to a rare deficit of -35,748.3 million USD in 2022, driven by soaring energy import costs and disrupted global trade. In 2023, the trade balance rebounded to a surplus of 37,332.9 million USD, reflecting stabilizing energy prices and strong export performance in machinery, vehicles, and luxury goods.
Italy’s trade dynamics underscore its dependence on energy imports and export-driven industries, with the 2023 recovery highlighting the resilience of its industrial and high-value manufacturing sectors.
Italy’s trade dynamics underscore its dependence on energy imports and export-driven industries, with the 2023 recovery highlighting the resilience of its industrial and high-value manufacturing sectors.
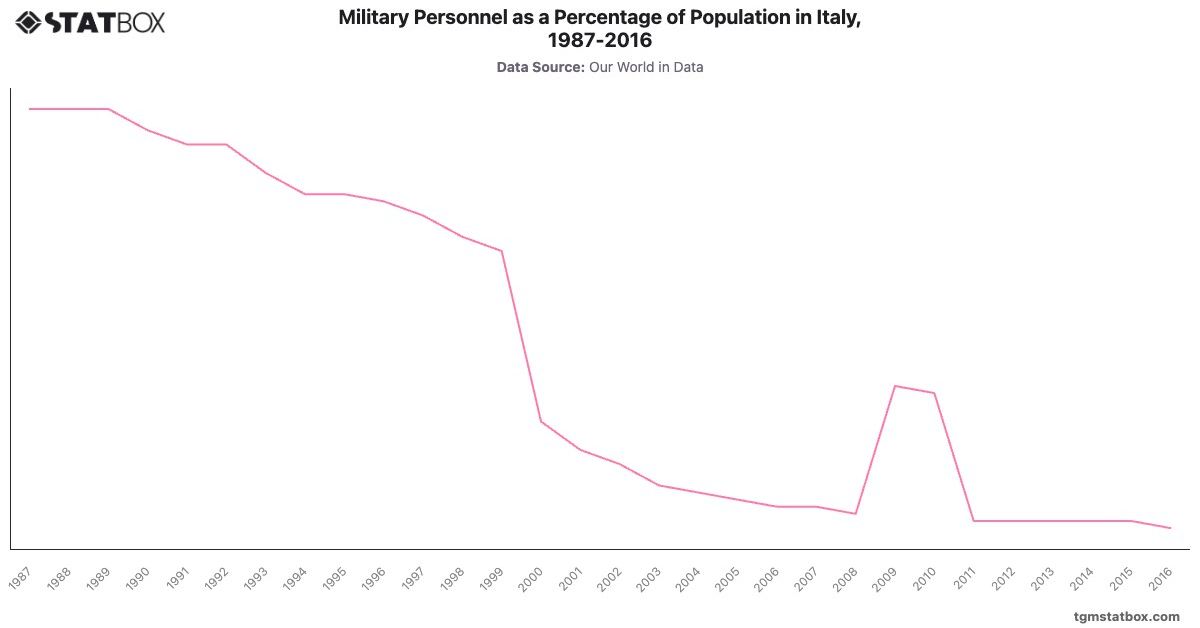
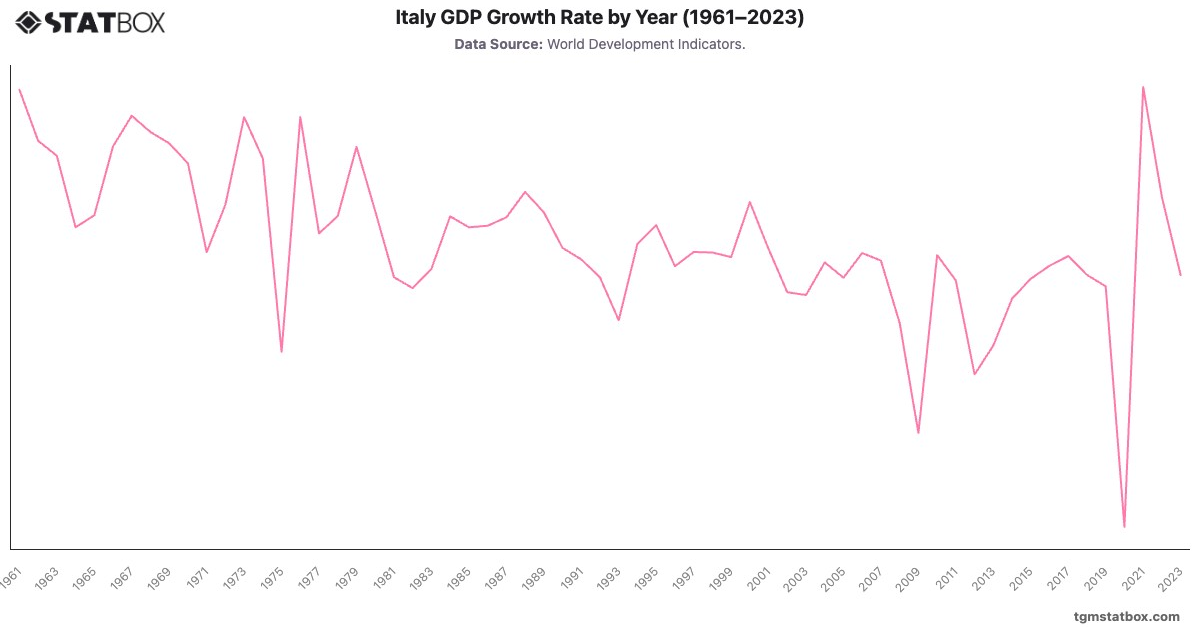
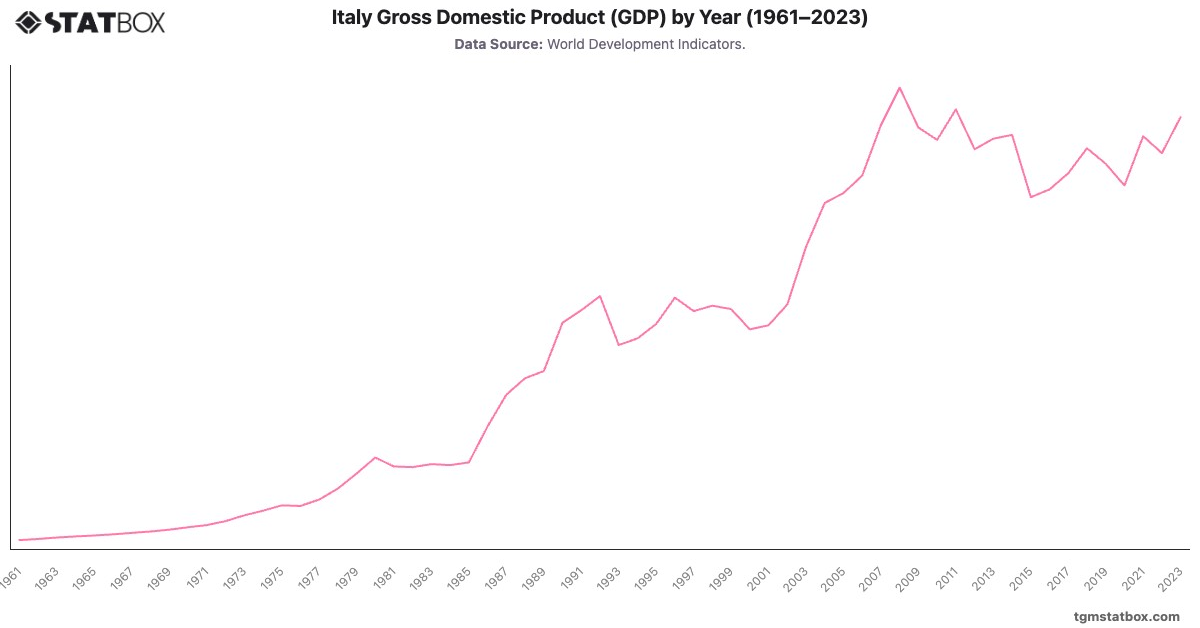
Gain a broader perspective by reviewing import value from Italy, Italy’s military personnel proportion, Italy’s annual GDP figures.