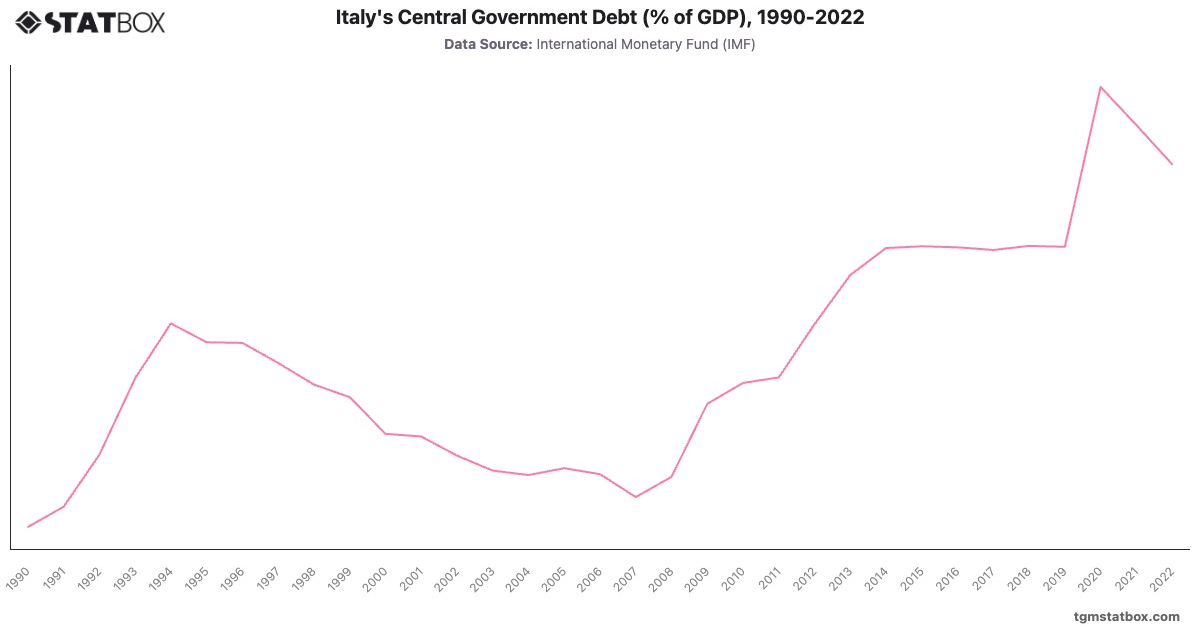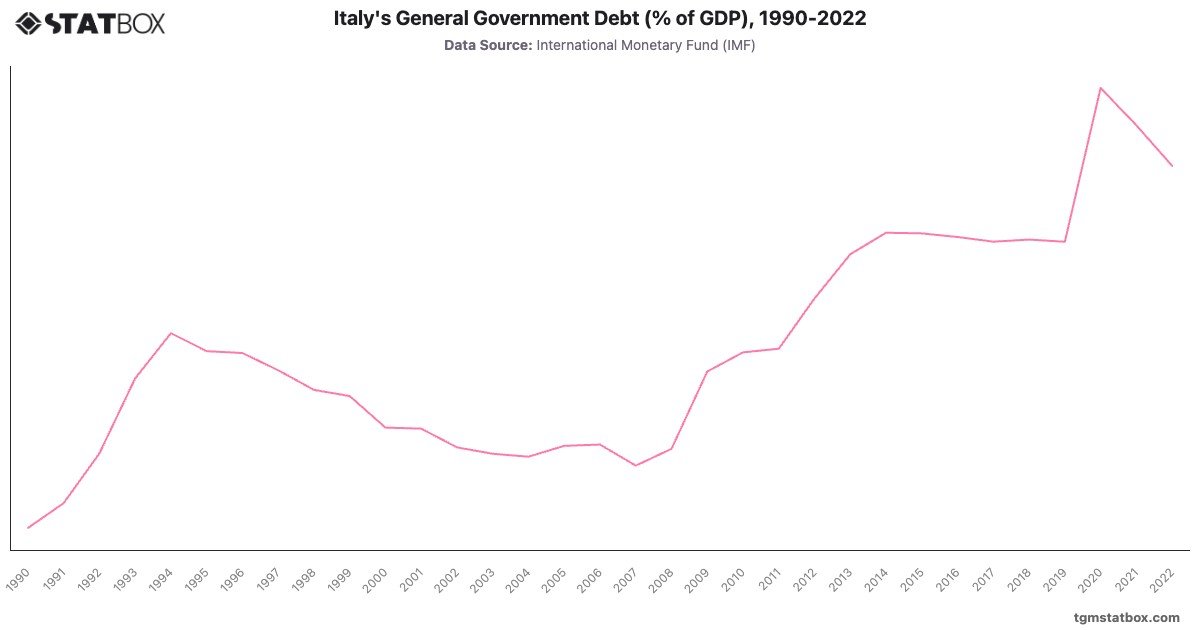
Italy’s debt-to-GDP ratio has historically been high, starting at in 1990. Structural challenges, including low economic growth and high public spending, contributed to this trajectory, with debt peaking at in 2014 following the eurozone debt crisis. Italy’s efforts to stabilize its finances managed to plateau the debt ratio but left it above for much of the 2010s.
The COVID-19 pandemic caused a sharp spike in debt to in 2020, one of the highest levels in the European Union. While a slight recovery was observed, bringing debt to by 2022, Italy faces ongoing fiscal challenges. Despite efforts for fiscal consolidation, its high debt remains a point of vulnerability, limiting flexibility in public finances amid economic fluctuations.
The COVID-19 pandemic caused a sharp spike in debt to in 2020, one of the highest levels in the European Union. While a slight recovery was observed, bringing debt to by 2022, Italy faces ongoing fiscal challenges. Despite efforts for fiscal consolidation, its high debt remains a point of vulnerability, limiting flexibility in public finances amid economic fluctuations.
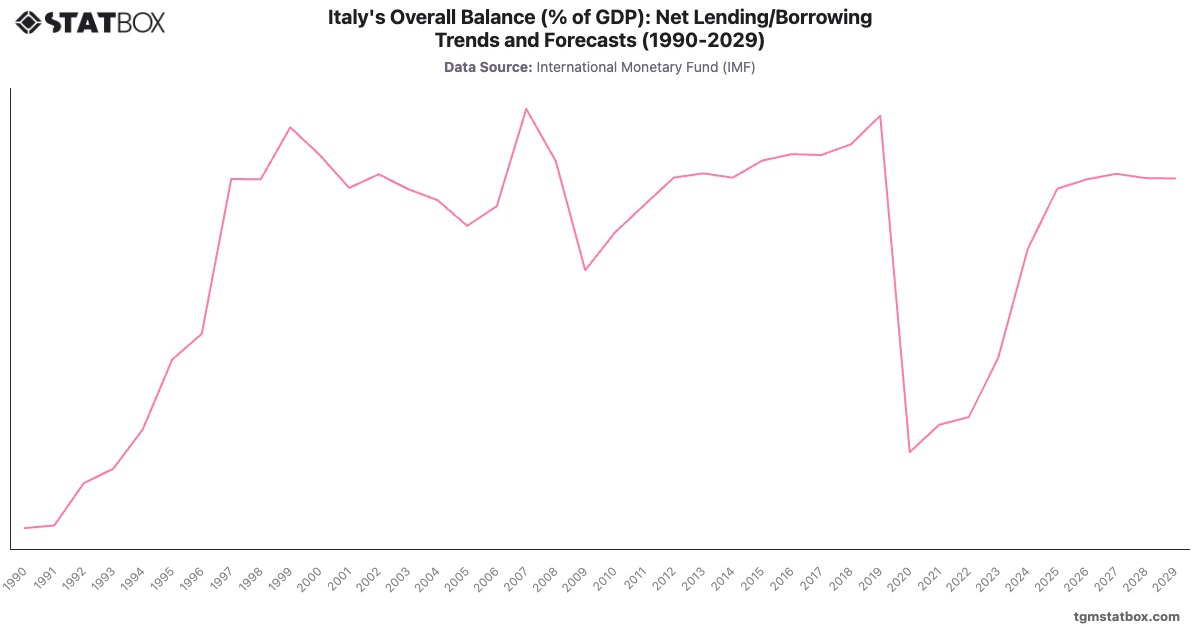
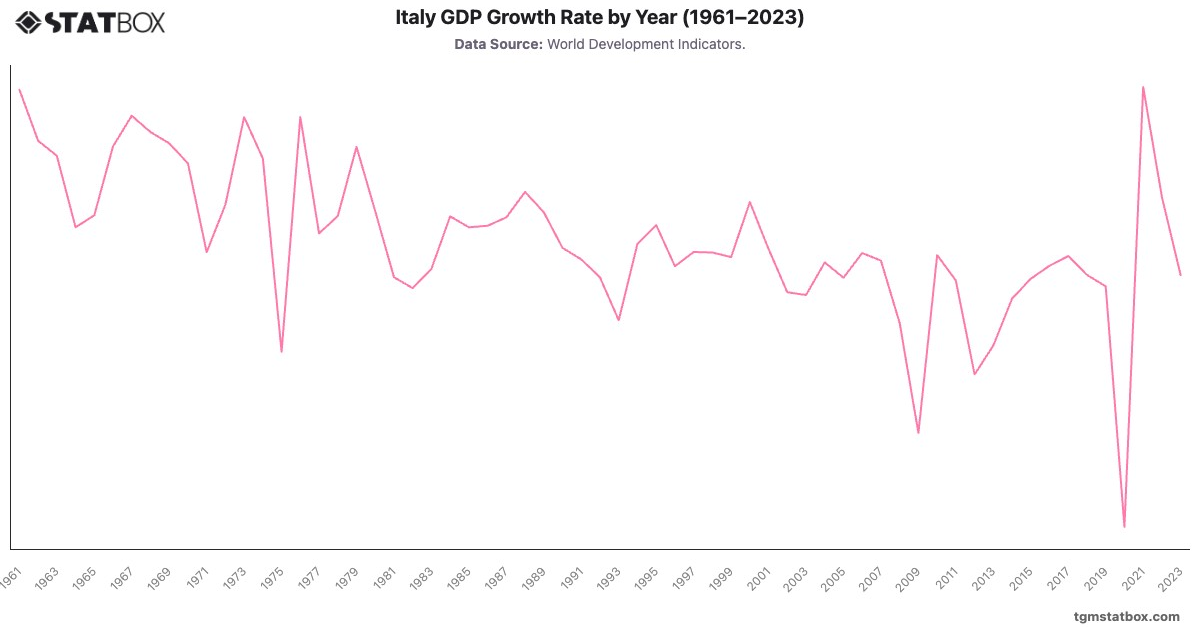
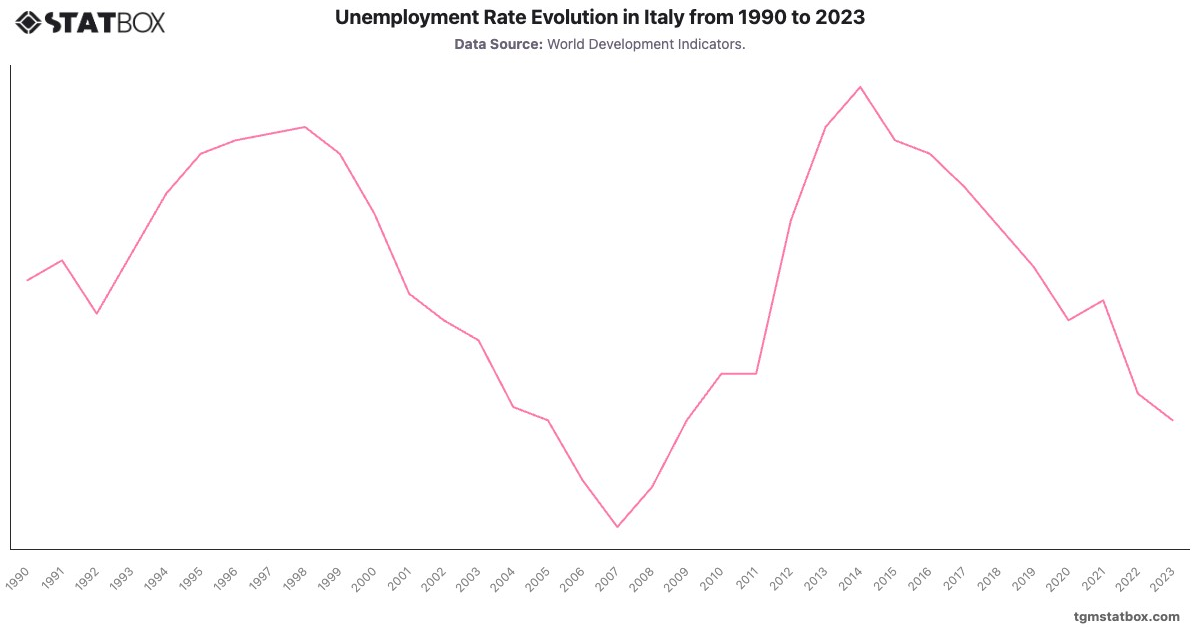
Discover additional trends and data on Italy’s net lending/borrowing as share of GDP, Italy’s unemployment rate trends, Italy’s annual GDP growth rate.