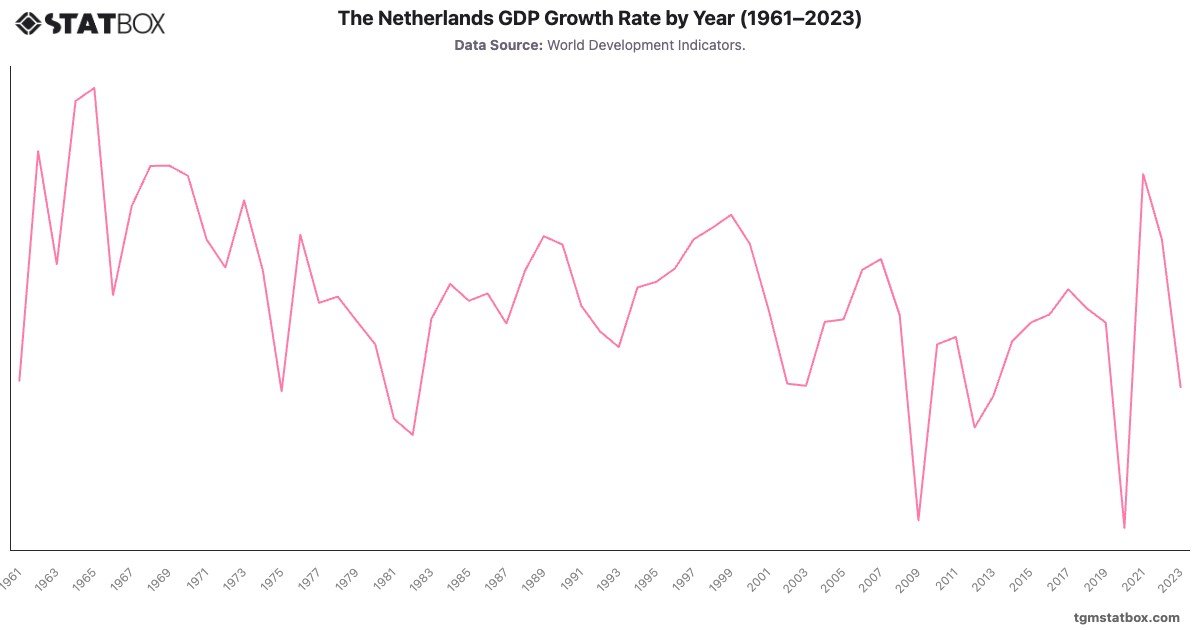
The Netherlands GDP Growth Rate by Year (1961–2023)

Unlock this statistic

Log in to unlock

No account? Sign up free — new members get 3 premium charts to view.

Insights

Key Takeaways

The Netherlands GDP Growth (1961-2023)

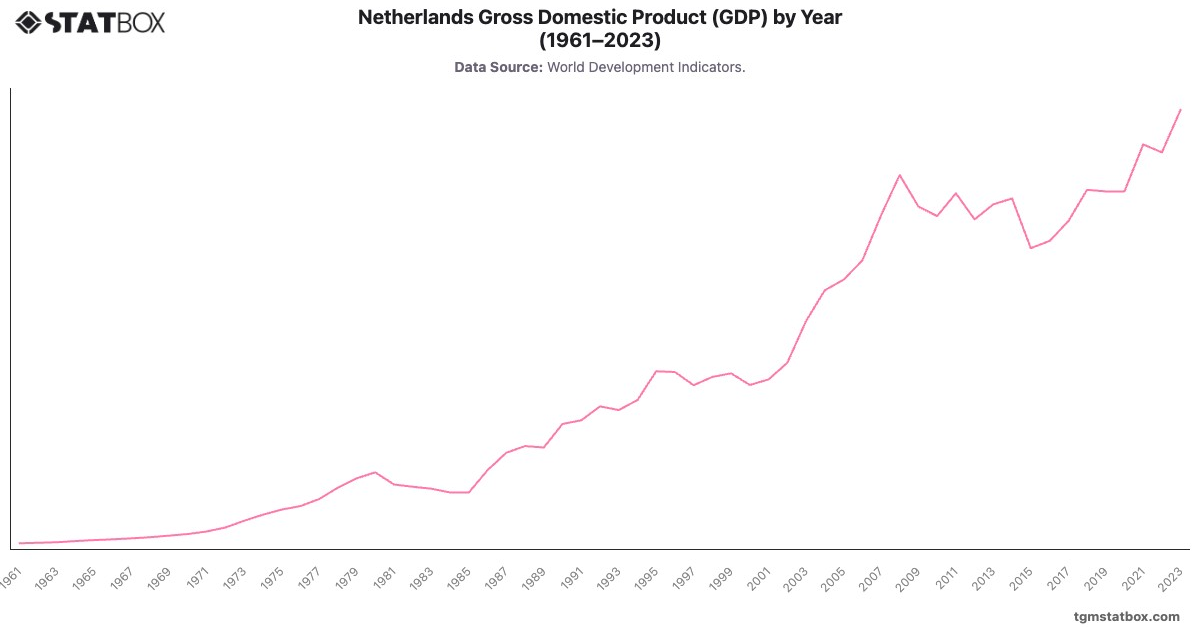
The Netherlands’ GDP growth rate reveals resilience despite global crises. The post-war era saw strong growth, peaking at in 1965. The economy faced challenges in the 1980s with mild contractions. Recovery followed, with steady growth into the 2000s. After a severe decline in 2009 during the financial crisis, the Netherlands bounced back, growing by in 2021. However, growth slowed to in 2023, reflecting inflationary pressures and global economic uncertainties.

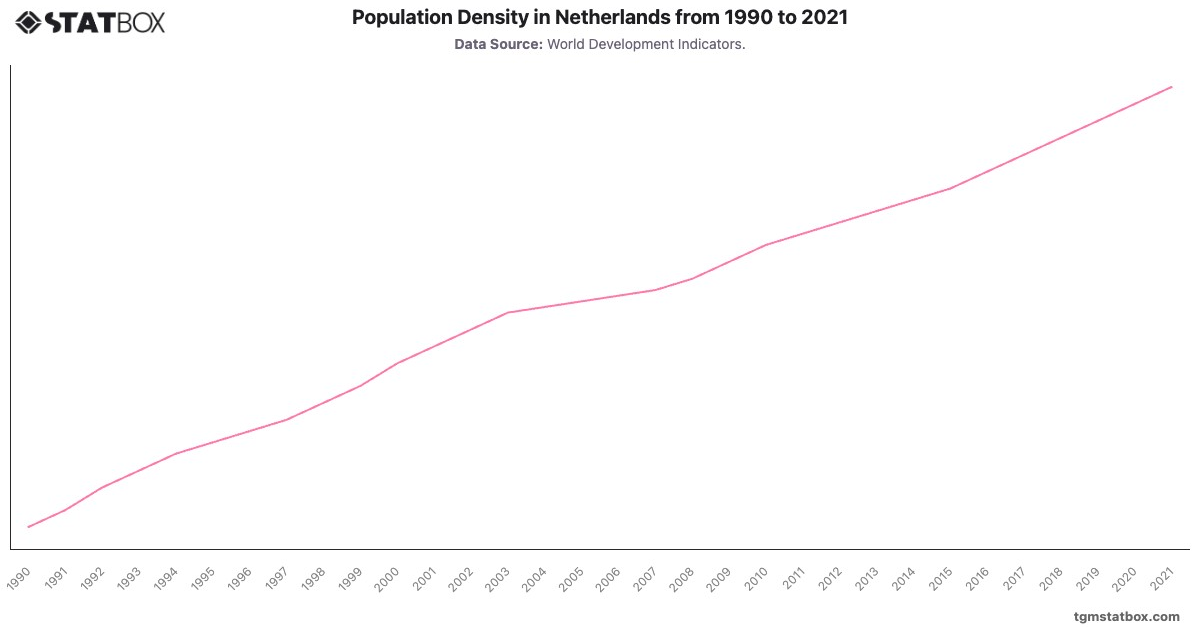
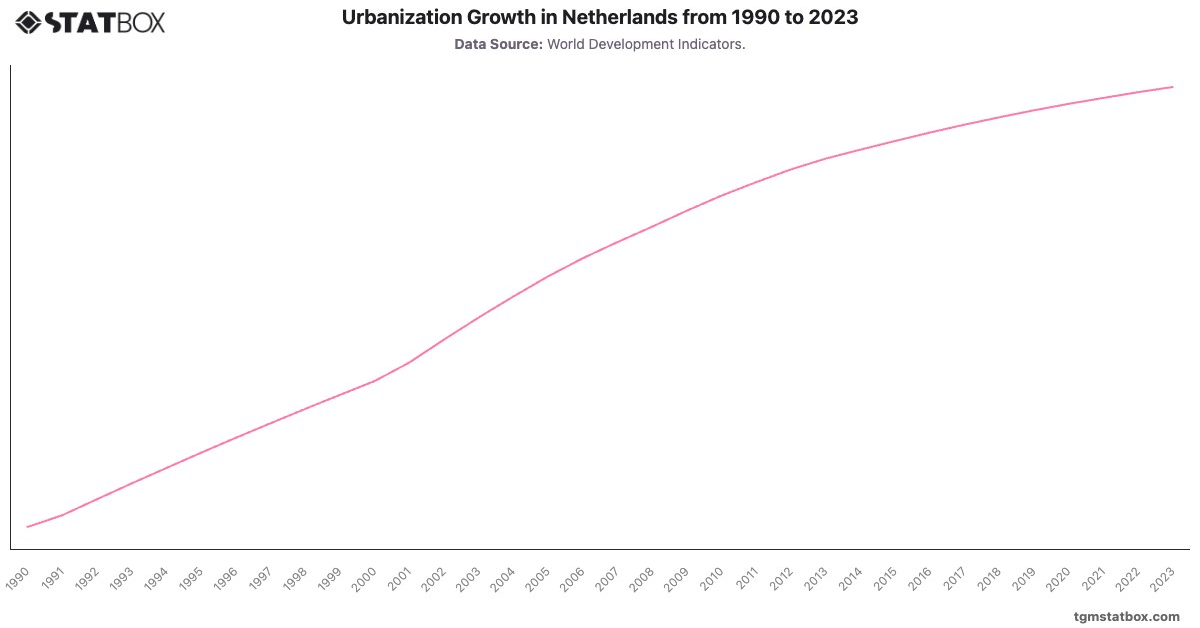
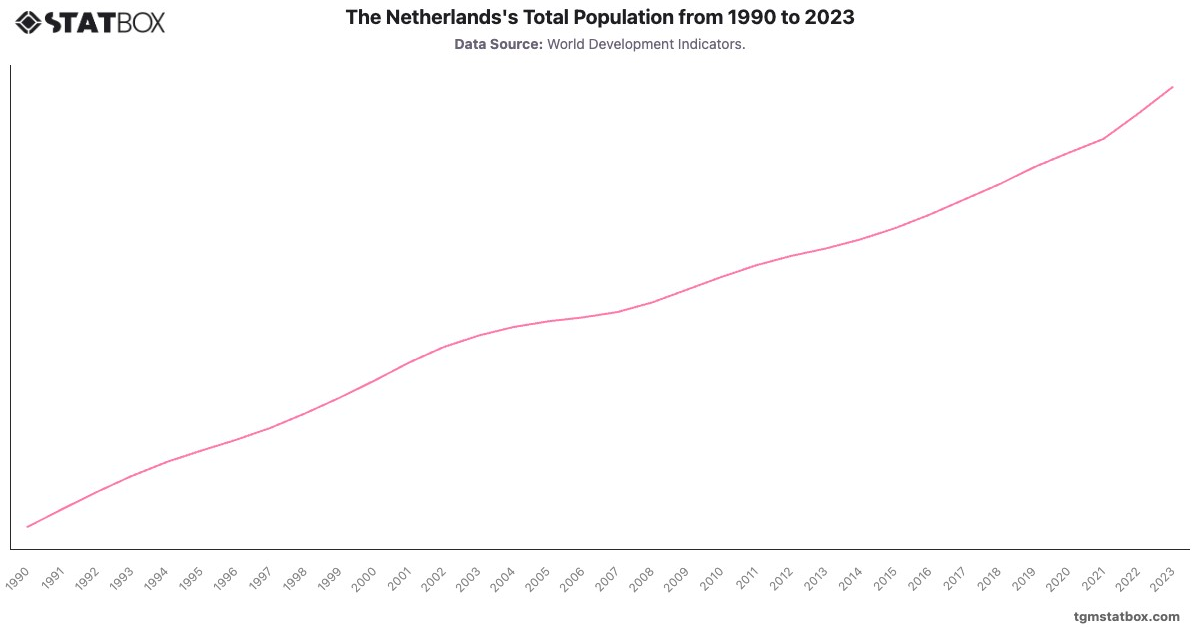
For a broader context, visit other statistics on Netherlands’ population growth, urbanization rate in the Netherlands, Netherlands’ annual GDP.

AI-powered chart insight: This summary is automatically generated to help you understand the chart at a glance. It is intended as an overview; view the full chart and underlying data for complete context.

Further Recommended Statistics

Statbox vector
Statbox |form contact icon

Have Other Queries?

Statbox vector

Connect with our expert team for immediate assistance or comprehensive market analysis. We are always ready to support your business needs.

Recommended for you

Charts you may like

Reports for you

Topics to explore