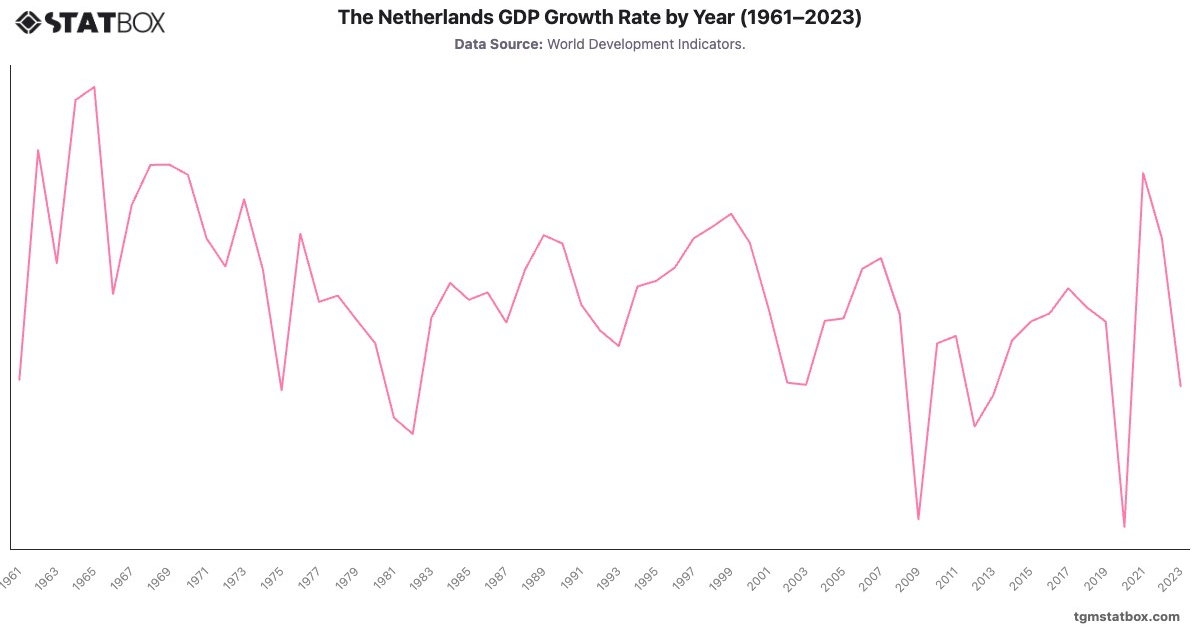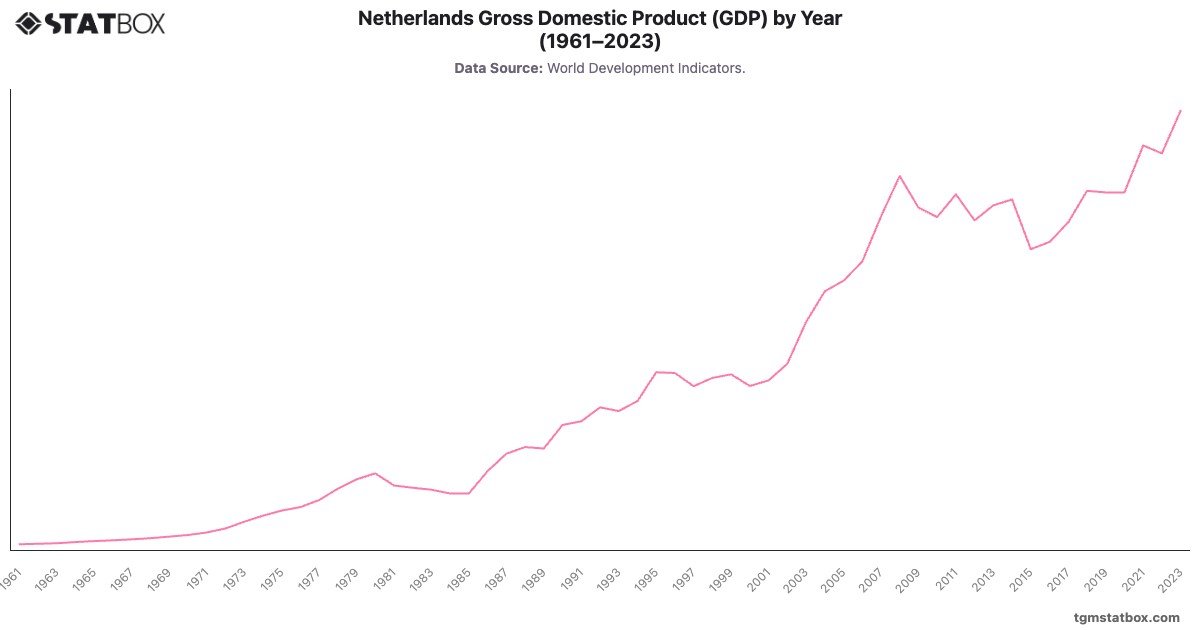
The Netherlands' GDP demonstrates steady growth, underpinned by its strong trade orientation and robust service sector. Starting at $14.6 billion in 1961, GDP grew rapidly through the 1970s, reaching $100 billion in 1975, supported by industrial expansion and North Sea oil and gas exploitation. Economic diversification and infrastructure investments in the 1980s further bolstered growth, with GDP climbing to $200 billion in 1986.
The global financial crisis in 2008 caused a contraction, reducing GDP from $951.8 billion in 2008 to $871.5 billion in 2009. Recovery efforts and innovation-driven policies fueled a rebound, with GDP exceeding $1.11 trillion in 2023, cementing the Netherlands' position as a key player in global logistics and technology.
The global financial crisis in 2008 caused a contraction, reducing GDP from $951.8 billion in 2008 to $871.5 billion in 2009. Recovery efforts and innovation-driven policies fueled a rebound, with GDP exceeding $1.11 trillion in 2023, cementing the Netherlands' position as a key player in global logistics and technology.
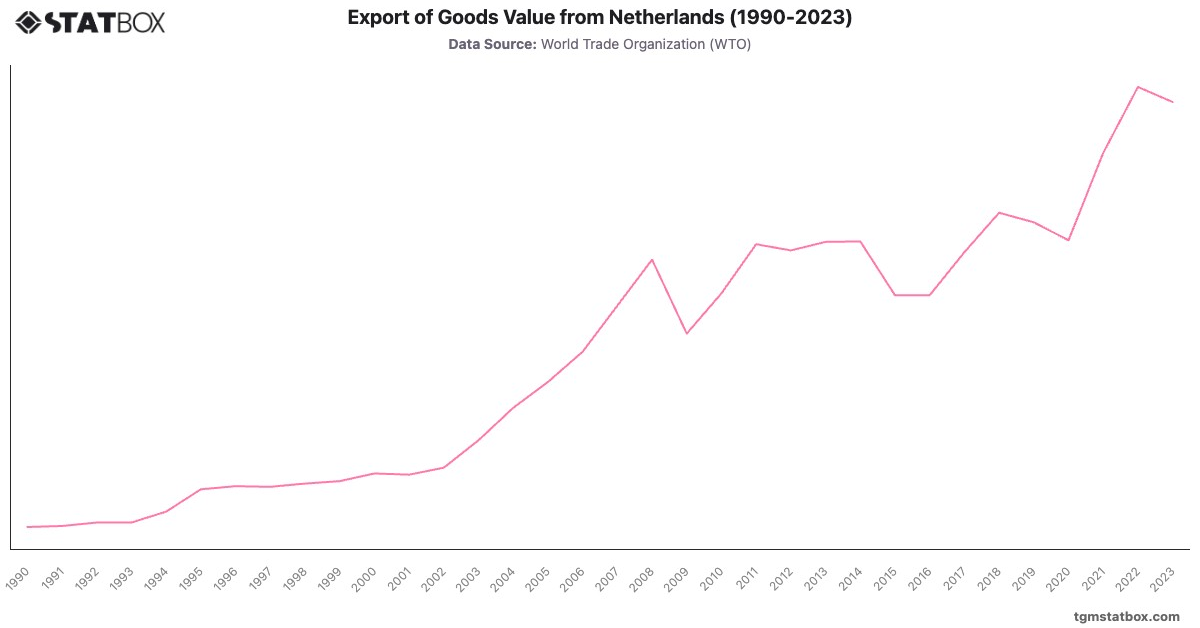
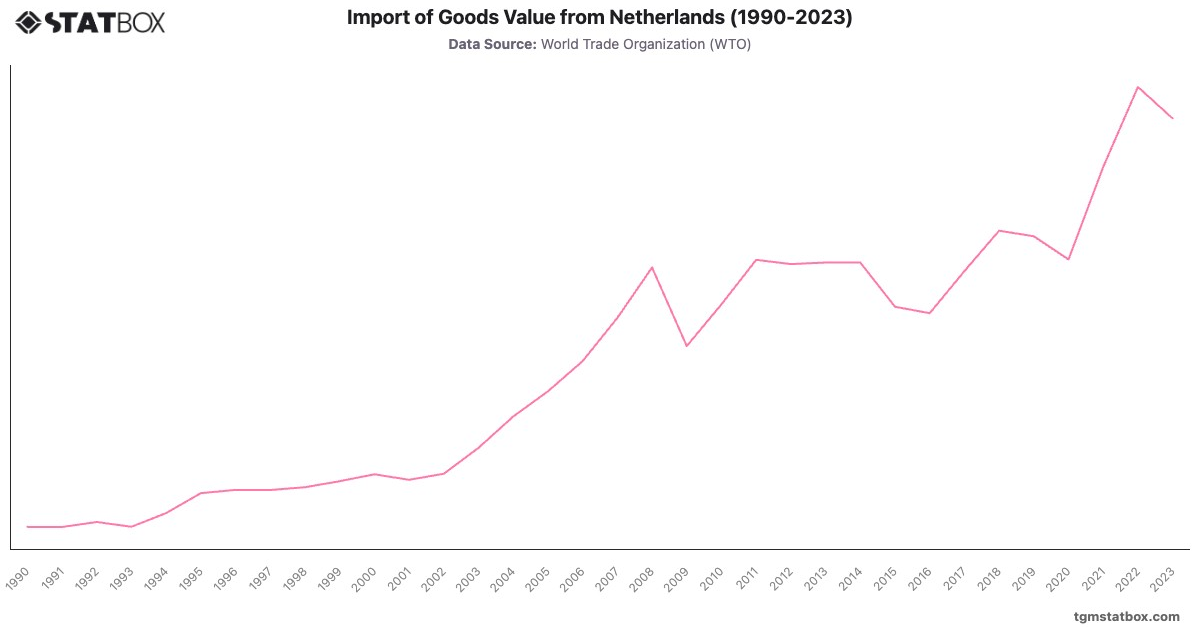
Explore related charts to gain a better understanding of Netherlands’ services GDP share, Netherlands’ export value, Netherlands’ goods import value.