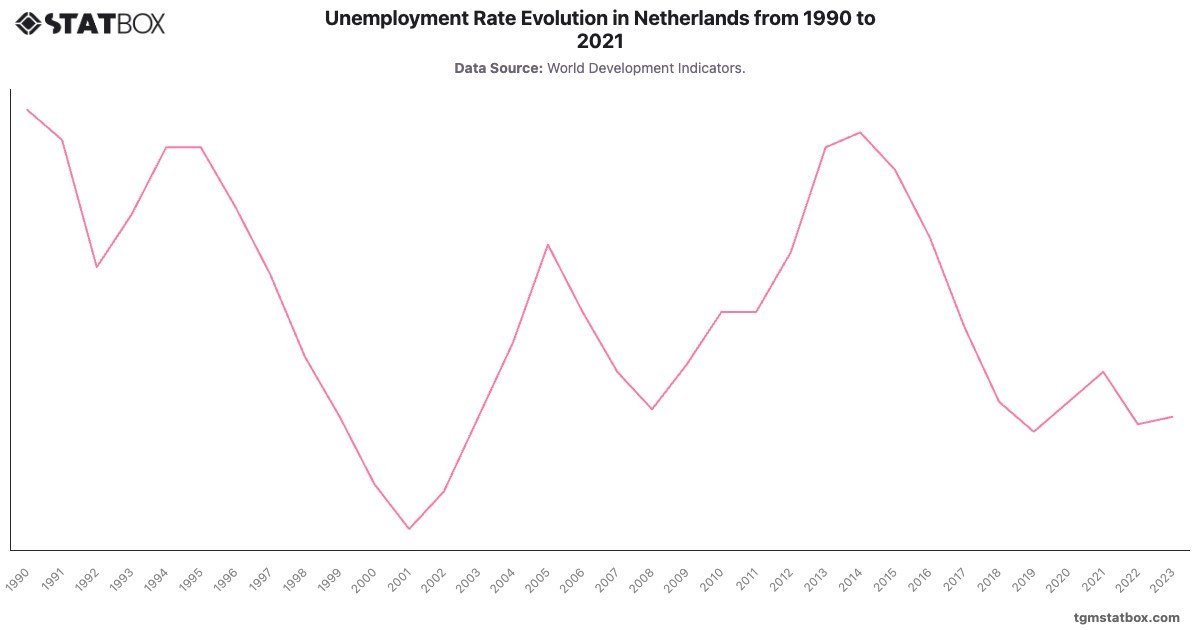
The unemployment rate in the Netherlands shows significant fluctuations between 1990 and 2023, reflecting the country’s economic cycles. In the early 1990s, the unemployment rate averaged around , reaching in 1990, but decreased gradually as the economy improved, reaching a low of by 2001. This period of decline corresponds to the economic reforms in the Netherlands, which helped to bolster employment. However, the early 2000s saw a reversal, with the unemployment rate rising to in 2005, impacted by a global economic slowdown and adjustments in the labor market.
Post-2008, the Netherlands faced another increase in unemployment, reaching in 2014, due to the effects of the global financial crisis. Subsequent recovery efforts were successful, as the rate dropped to by 2019. The pandemic disrupted this trend, but the Netherlands managed to maintain relatively stable employment with a slight rise to in 2021. By 2023, the rate settled at , reflecting the country’s resilience and steady labor market adjustments.
Post-2008, the Netherlands faced another increase in unemployment, reaching in 2014, due to the effects of the global financial crisis. Subsequent recovery efforts were successful, as the rate dropped to by 2019. The pandemic disrupted this trend, but the Netherlands managed to maintain relatively stable employment with a slight rise to in 2021. By 2023, the rate settled at , reflecting the country’s resilience and steady labor market adjustments.
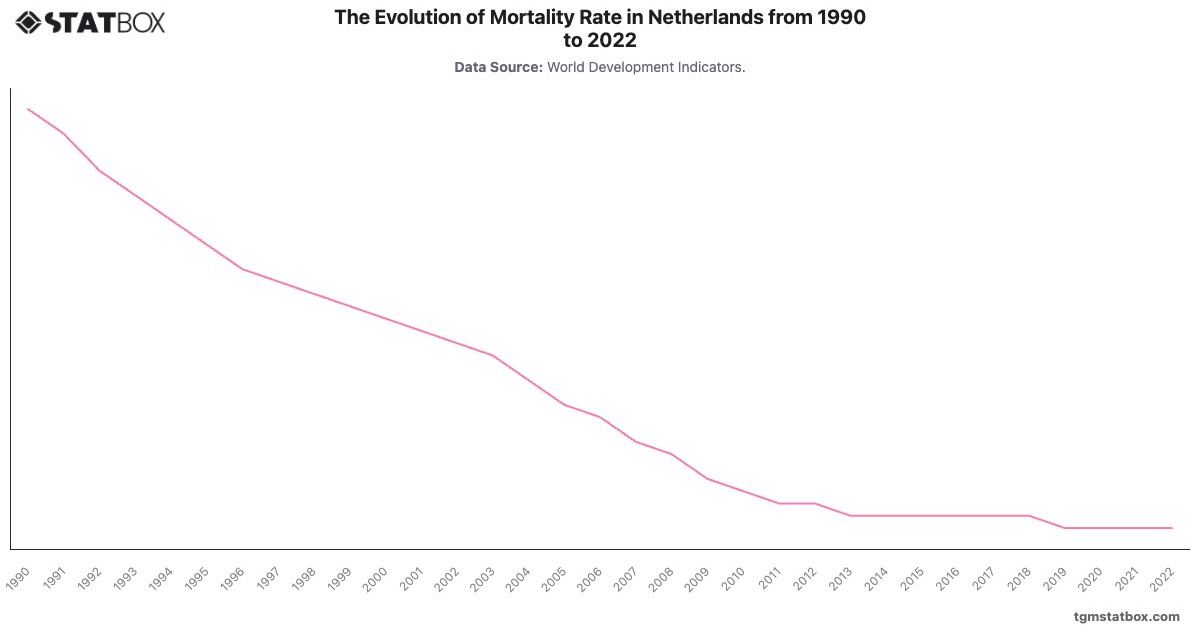
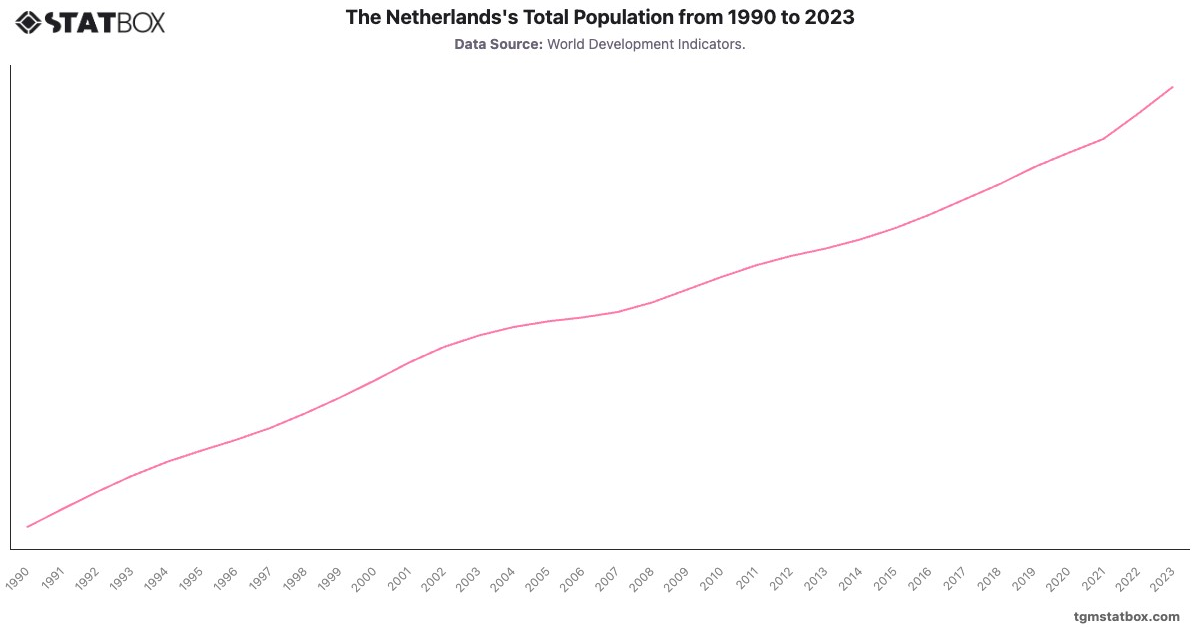
For additional information, visit statistics on Netherlands fertility rate trends, Netherlands’ evolving mortality rate, Netherlands’s population count.