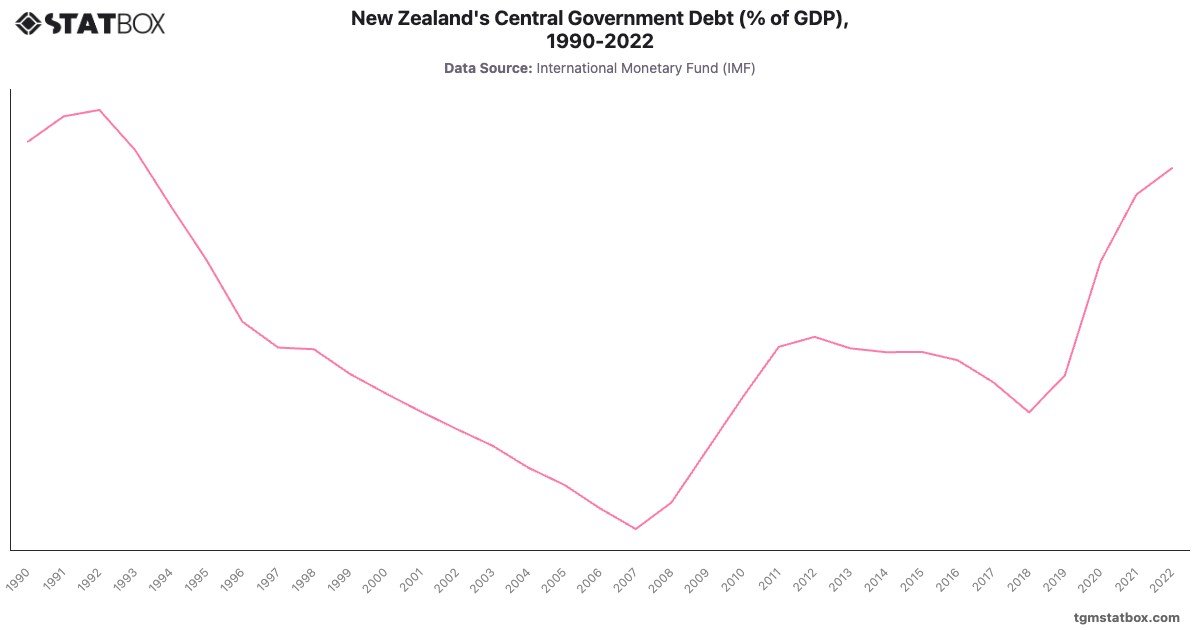
New Zealand experienced a significant reduction in central government debt as a percentage of GDP from 1990 to 2008, driven by fiscal reforms and strong economic performance. Debt peaked at in 1992 but declined steadily to a low of by 2007. This period of fiscal consolidation included budget surpluses and prudent public spending, aided by structural reforms in the 1980s and 1990s.
However, the global financial crisis in 2008 marked a turning point, with debt rising from in 2008 to by 2011. Government stimulus measures and earthquake recovery costs contributed to the increase. Debt remained relatively stable until 2019 but surged in 2020 to due to COVID-19 pandemic-related expenditures, reaching by 2022 as the government managed economic recovery efforts.
However, the global financial crisis in 2008 marked a turning point, with debt rising from in 2008 to by 2011. Government stimulus measures and earthquake recovery costs contributed to the increase. Debt remained relatively stable until 2019 but surged in 2020 to due to COVID-19 pandemic-related expenditures, reaching by 2022 as the government managed economic recovery efforts.
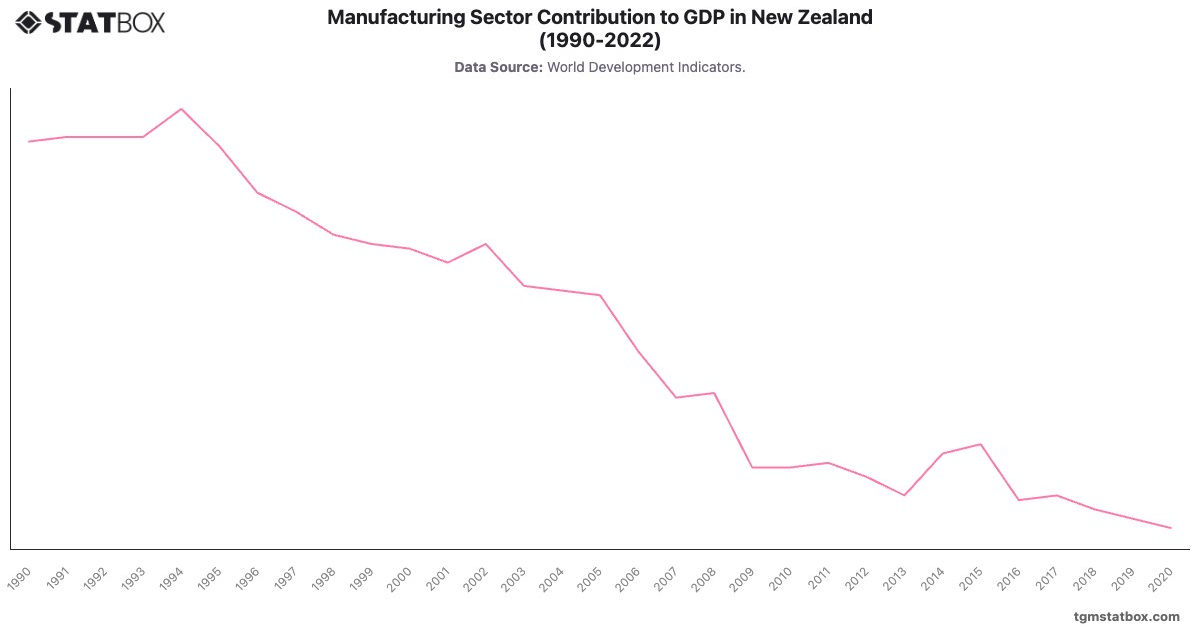
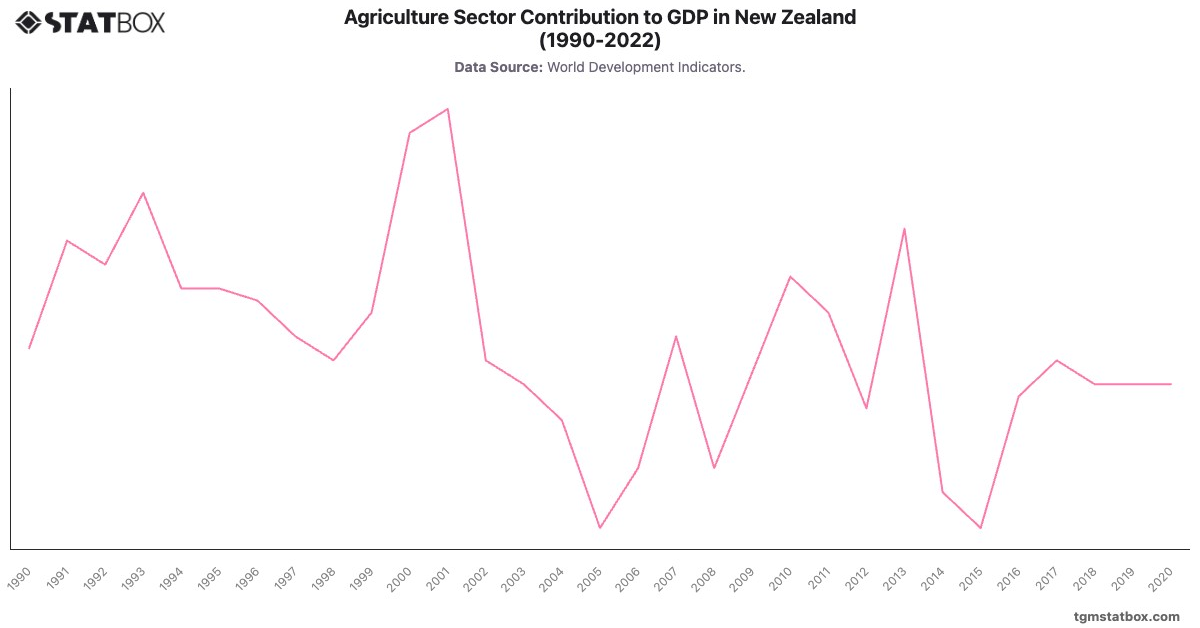
Discover additional trends and data on New Zealand’s manufacturing sector GDP share, Agriculture’s share in New Zealand’s GDP, New Zealand’s yearly GDP growth rate.