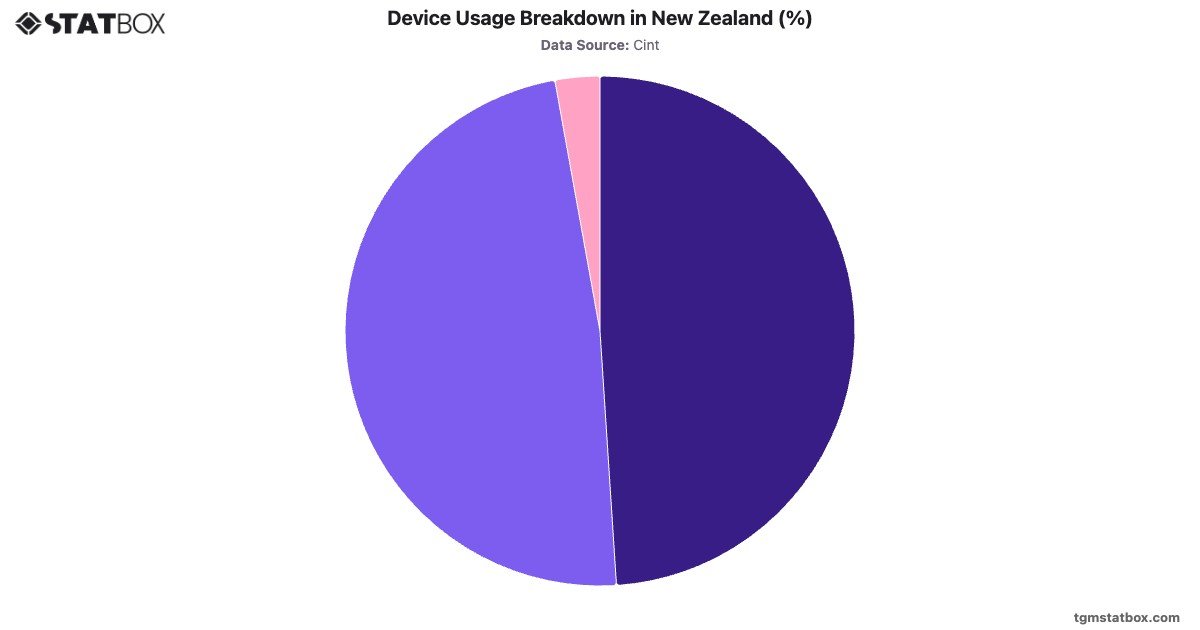
Device Usage Breakdown in New Zealand (%)

Unlock this statistic

Log in to unlock

No account? Sign up free — new members get 3 premium charts to view.

Insights

Key Takeaways

New Zealand showcases a balanced device usage pattern, with on mobile and on computers. This distribution reflects a technologically advanced society where both platforms are utilized for various purposes, including work and education. The minimal tablet usage () indicates that users are more inclined toward traditional computing and mobile solutions.

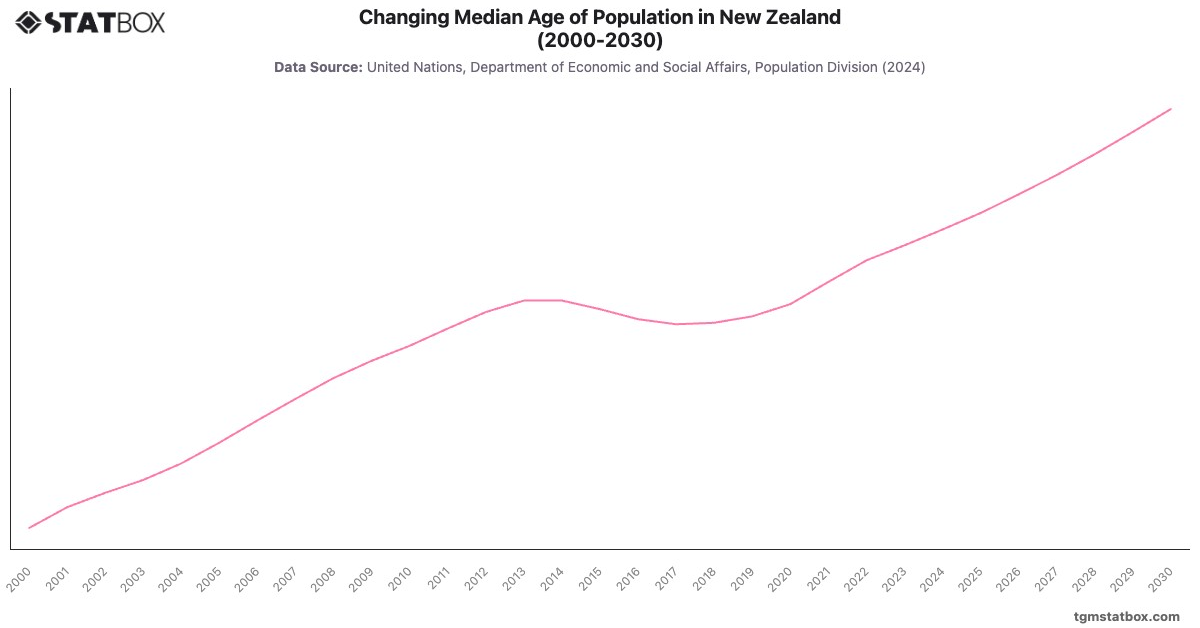
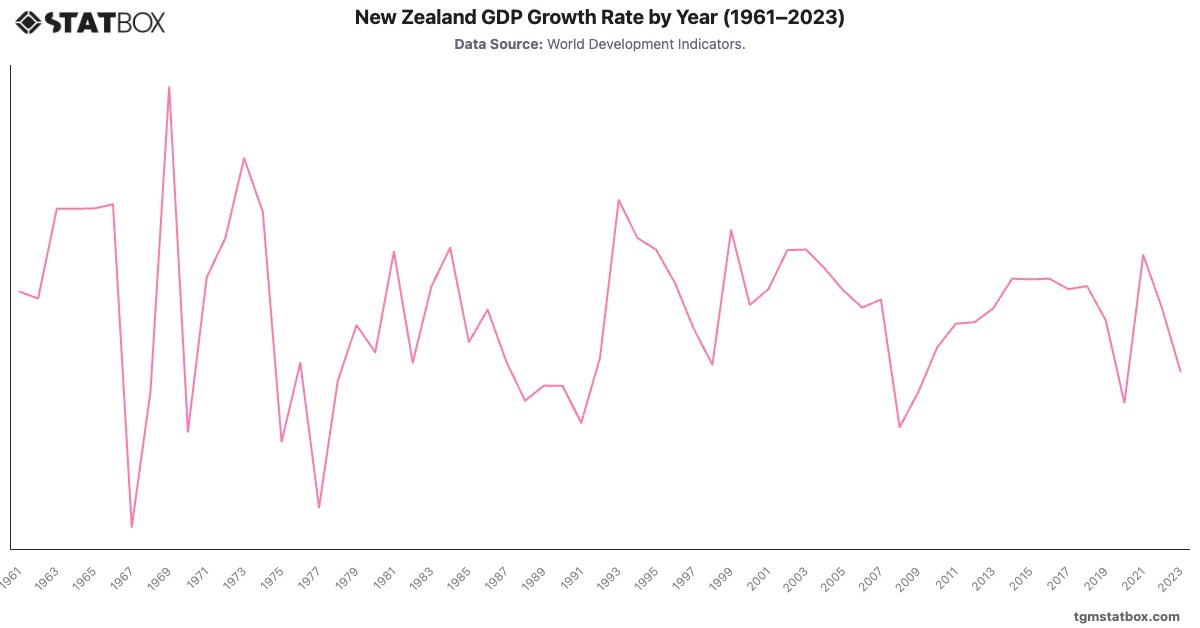
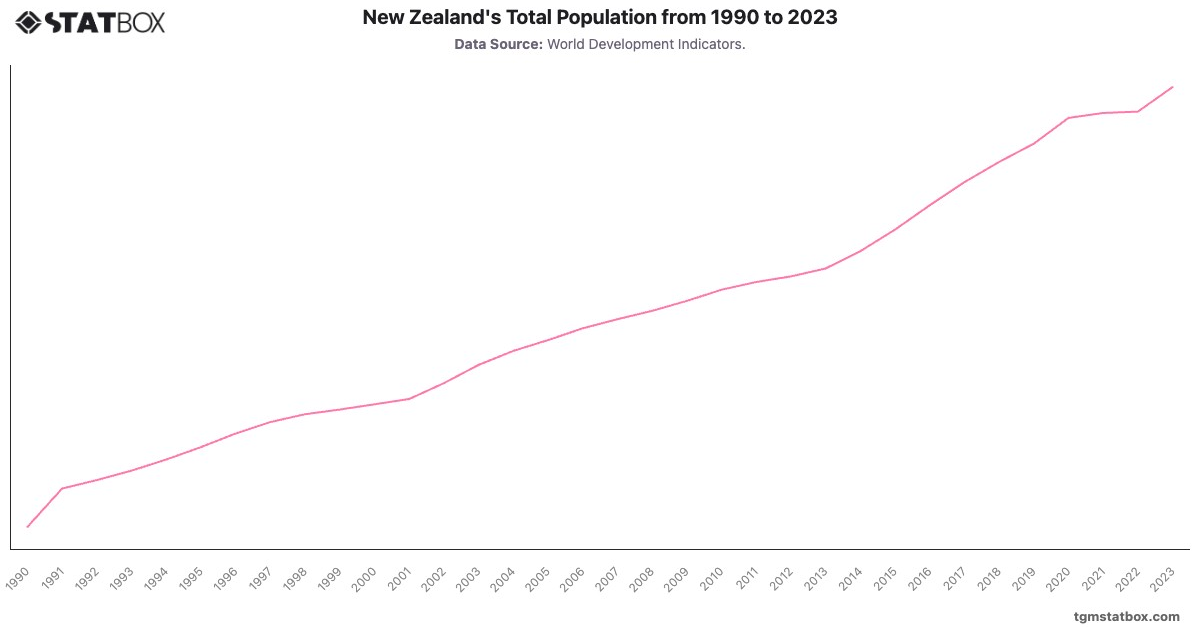
Find out more through related statistics on New Zealand’s unemployment rate trend, New Zealand’s working age population ratio, New Zealand’s median age evolution.

AI-powered chart insight: This summary is automatically generated to help you understand the chart at a glance. It is intended as an overview; view the full chart and underlying data for complete context.

Would you like to know more?
Check our report on this topic

Sustainability Report: Insights in New Zealand

New Zealand Sustainability Insights Report 2024

Sustainability Report: Insights in New Zealand

Learn more about sustainability insights in New Zealand with TGM StatBox. Explore in-depth insight report, featuring user behavior, trends, and preferences.

Go to report

Further Recommended Statistics

Statbox vector
Statbox |form contact icon

Have Other Queries?

Statbox vector

Connect with our expert team for immediate assistance or comprehensive market analysis. We are always ready to support your business needs.

Recommended for you

Charts you may like

Reports for you

Topics to explore