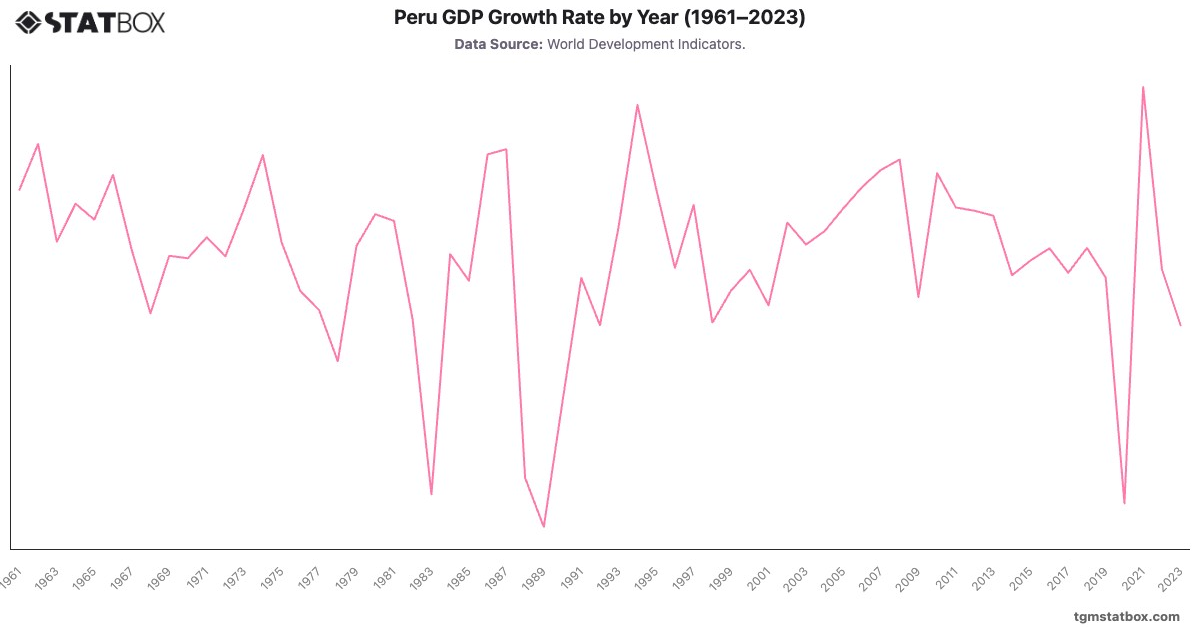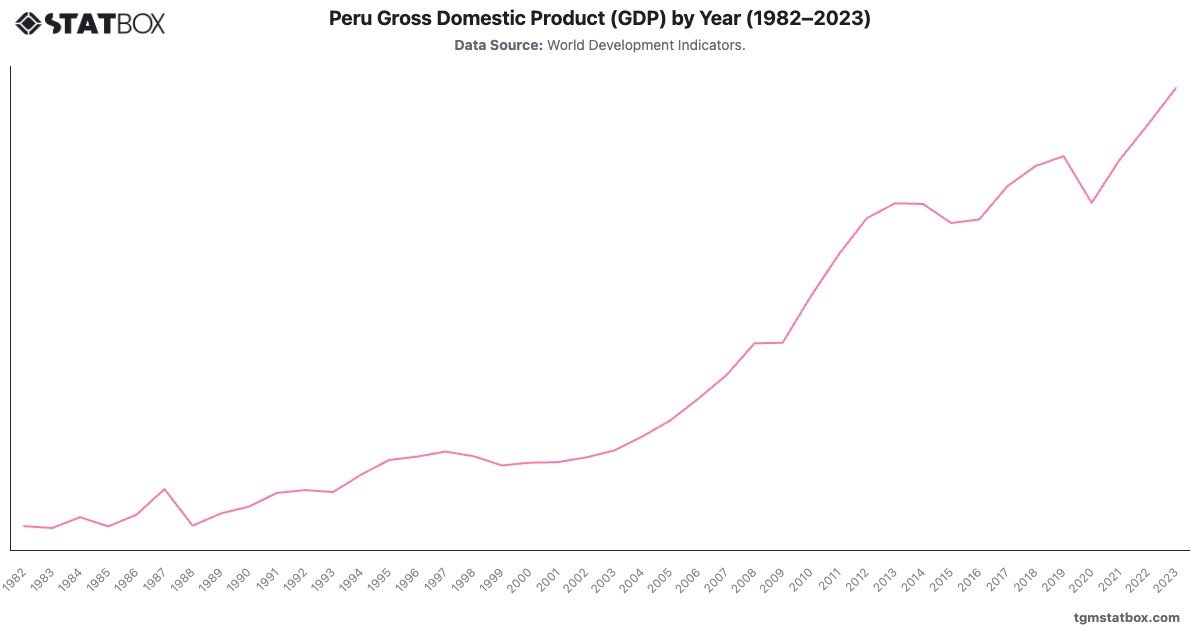
Peru's GDP growth highlights its journey from economic instability to sustained expansion. From $15.2 billion in 1982, GDP experienced fluctuations due to political challenges and hyperinflation in the 1980s. Economic liberalization and resource exports in the 1990s fostered growth, with GDP climbing to $53.3 billion in 1995.
The 2000s marked a period of sustained expansion, driven by mining and trade, with GDP reaching $267.6 billion in 2023. Investments in infrastructure and social programs have further supported Peru’s robust economic growth, positioning it as a key regional player.
The 2000s marked a period of sustained expansion, driven by mining and trade, with GDP reaching $267.6 billion in 2023. Investments in infrastructure and social programs have further supported Peru’s robust economic growth, positioning it as a key regional player.
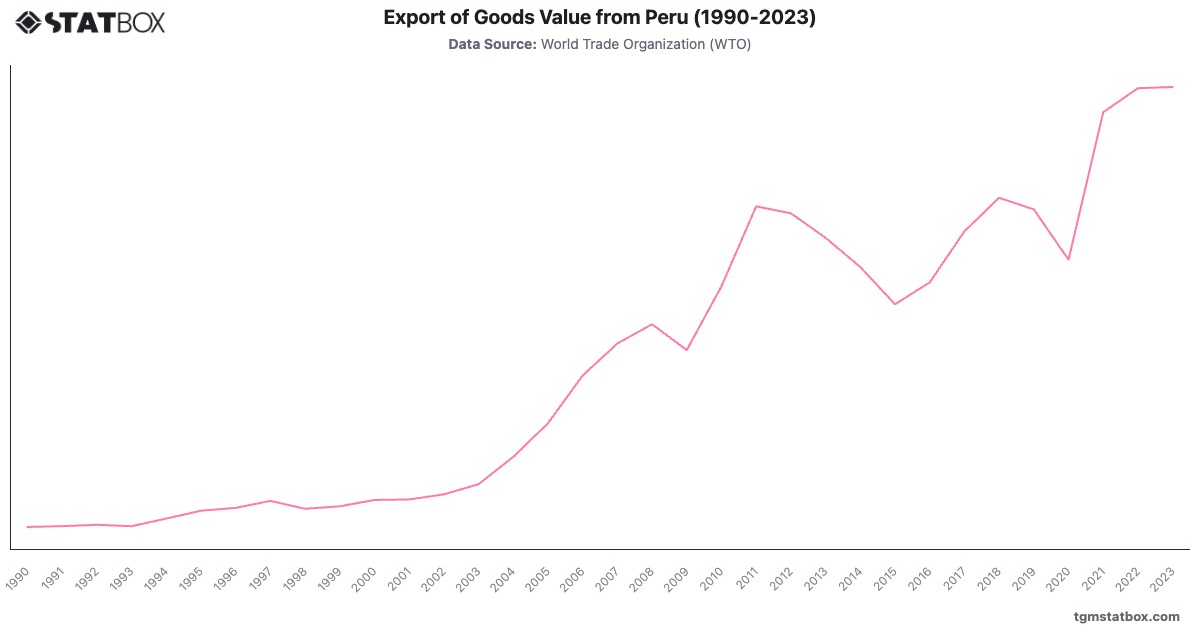
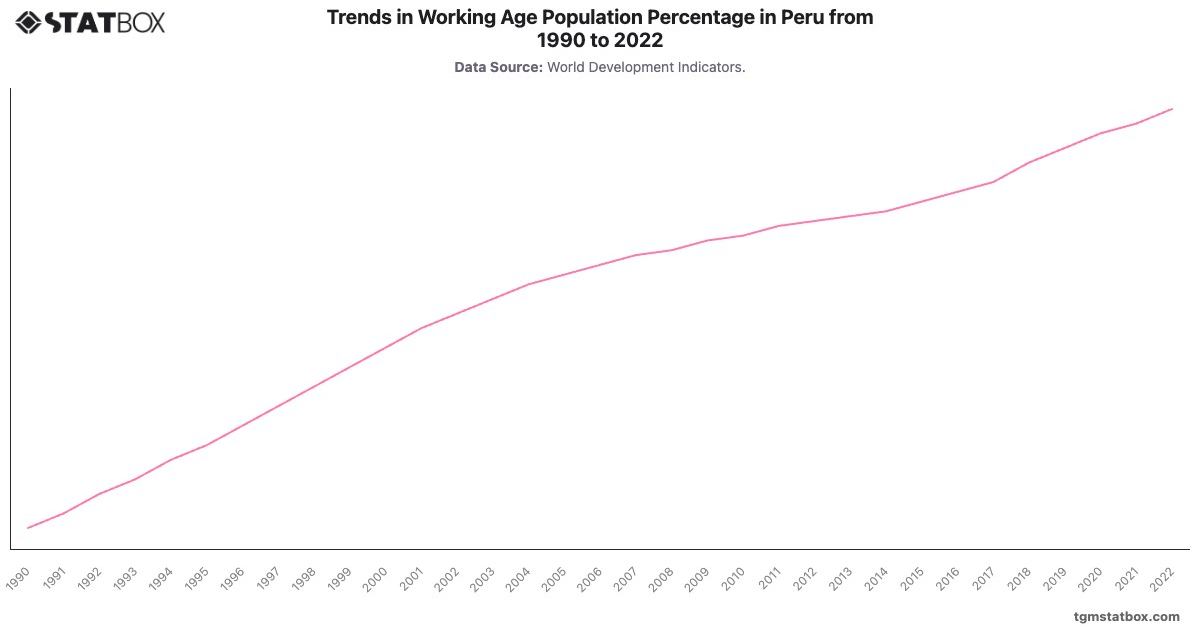
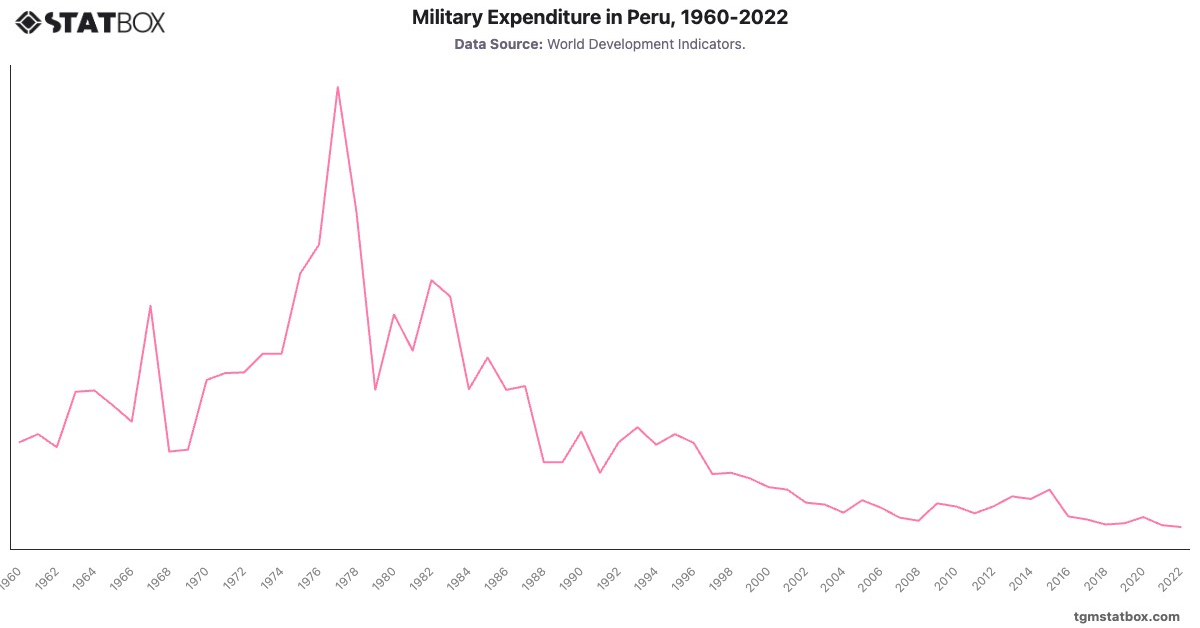
Gain a broader perspective by reviewing Peruvian export value, Peru’s military spending, Percentage of working-age population in Peru.