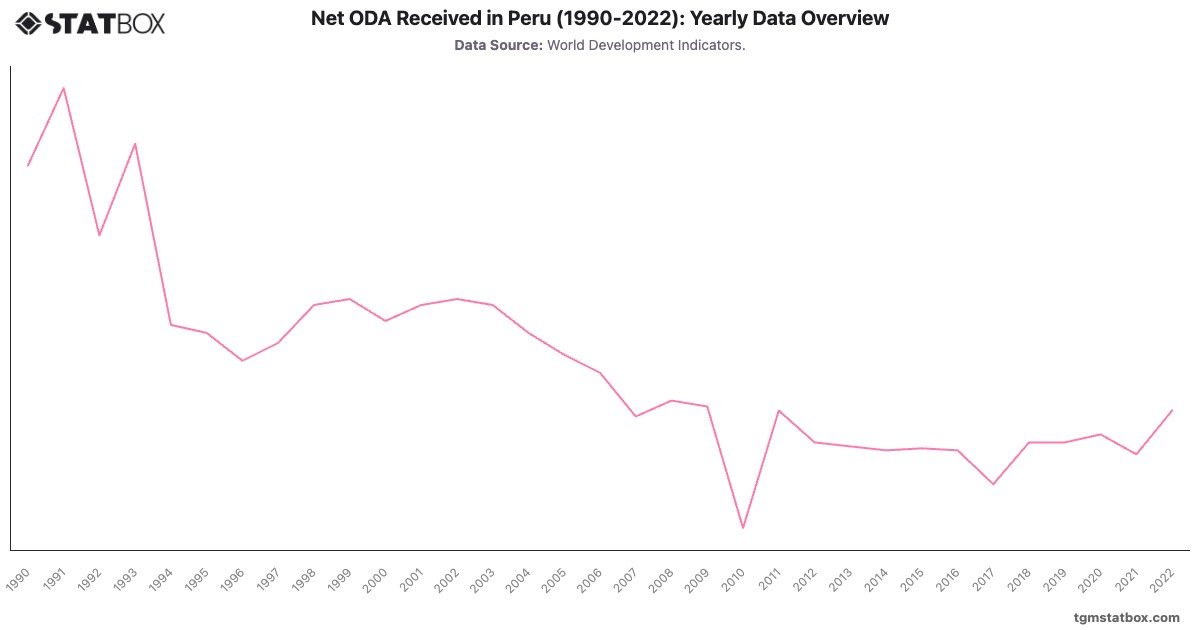
Peru's Net ODA (% of GNI) was highest in the early 1990s, peaking at in 1991, driven by international efforts to combat economic instability and insurgency. Aid gradually declined throughout the decade as Peru’s economy stabilized, dropping to by 1996. Negative levels in 2010 (-) reflect net repayments exceeding aid inflows.
In recent years, ODA has hovered between and , reflecting Peru’s transition to a middle-income country. The slight increase to in 2022 indicates targeted aid for social programs or environmental initiatives amid global challenges.
In recent years, ODA has hovered between and , reflecting Peru’s transition to a middle-income country. The slight increase to in 2022 indicates targeted aid for social programs or environmental initiatives amid global challenges.
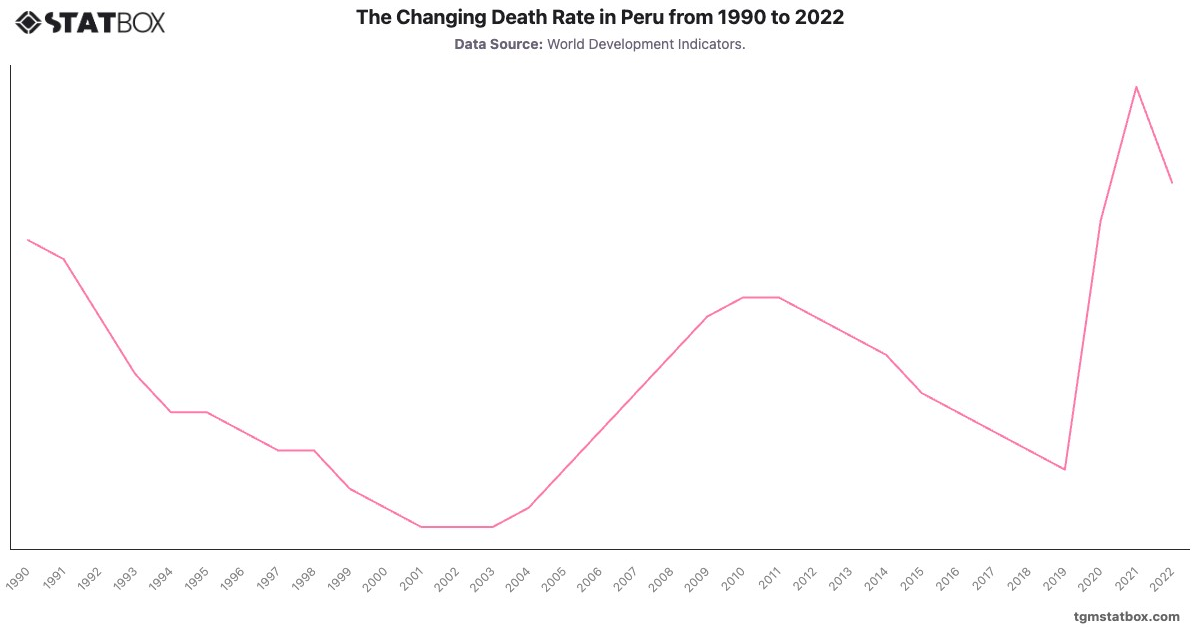
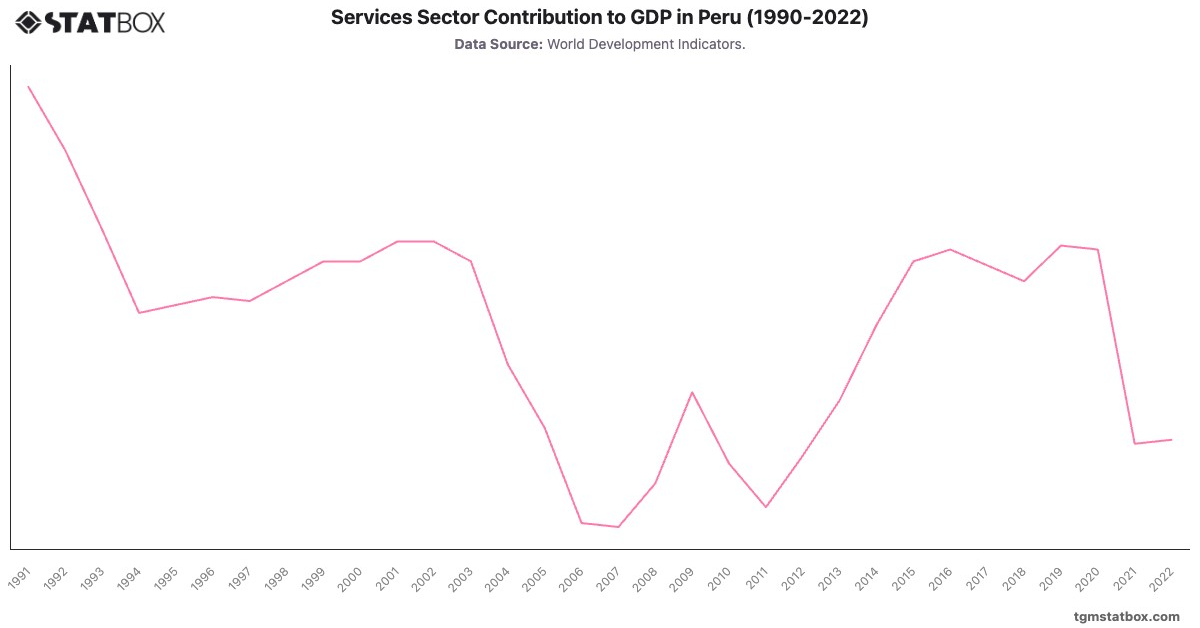
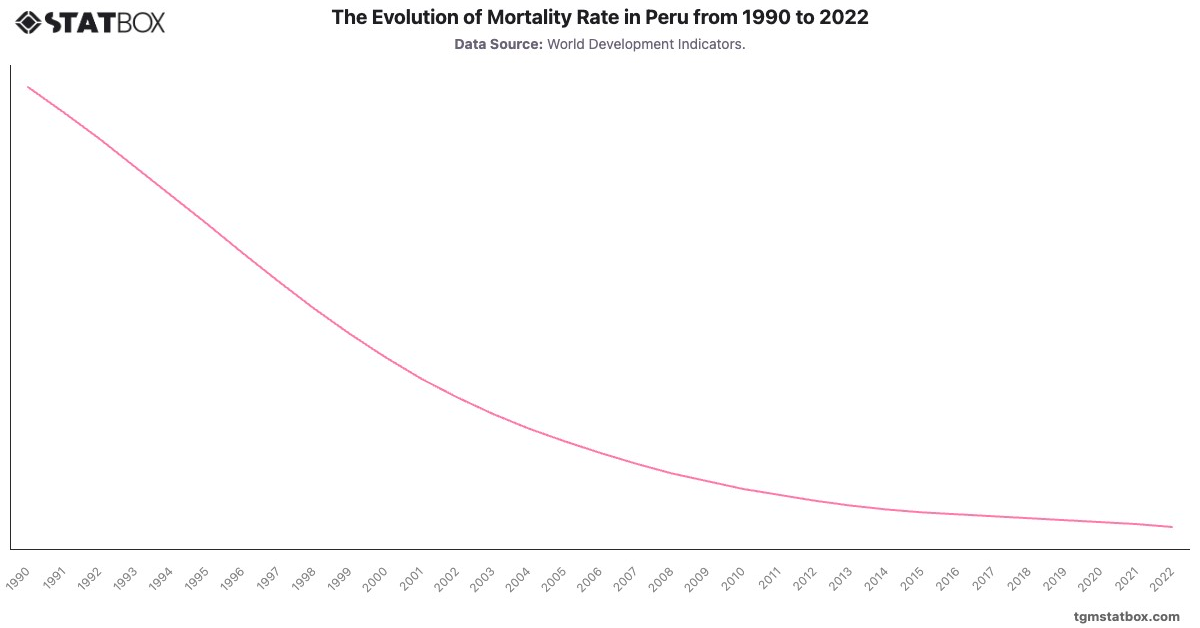
For a broader context, visit other statistics on Peru’s mortality rate trend, Peru’s agricultural sector contribution to GDP, industry’s share in Peru’s GDP.