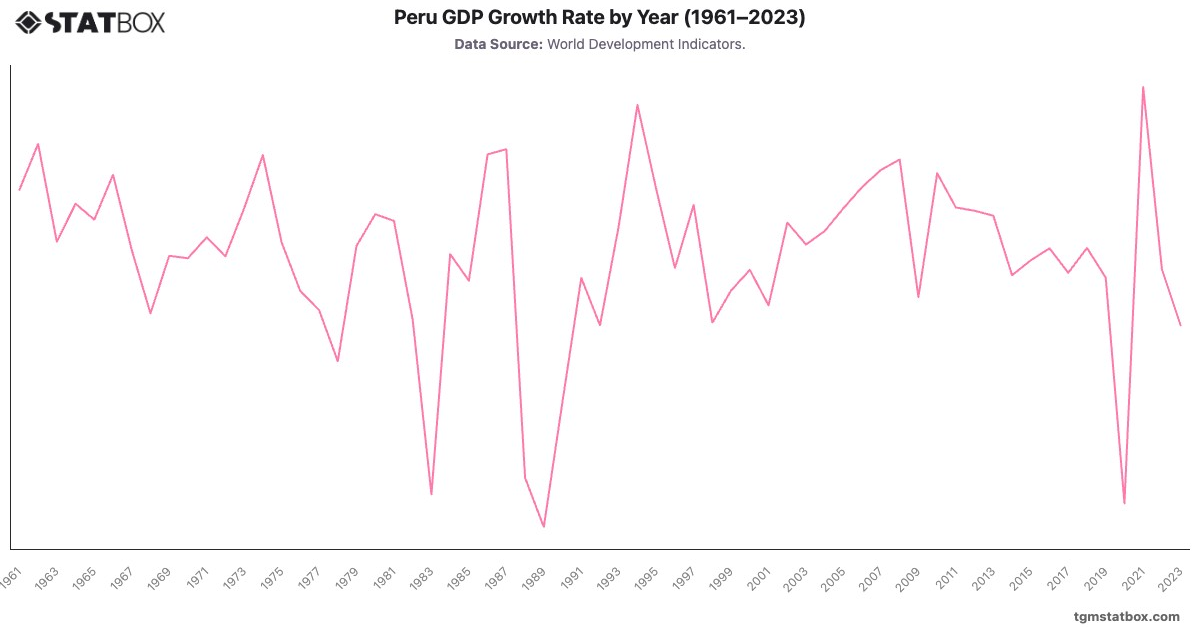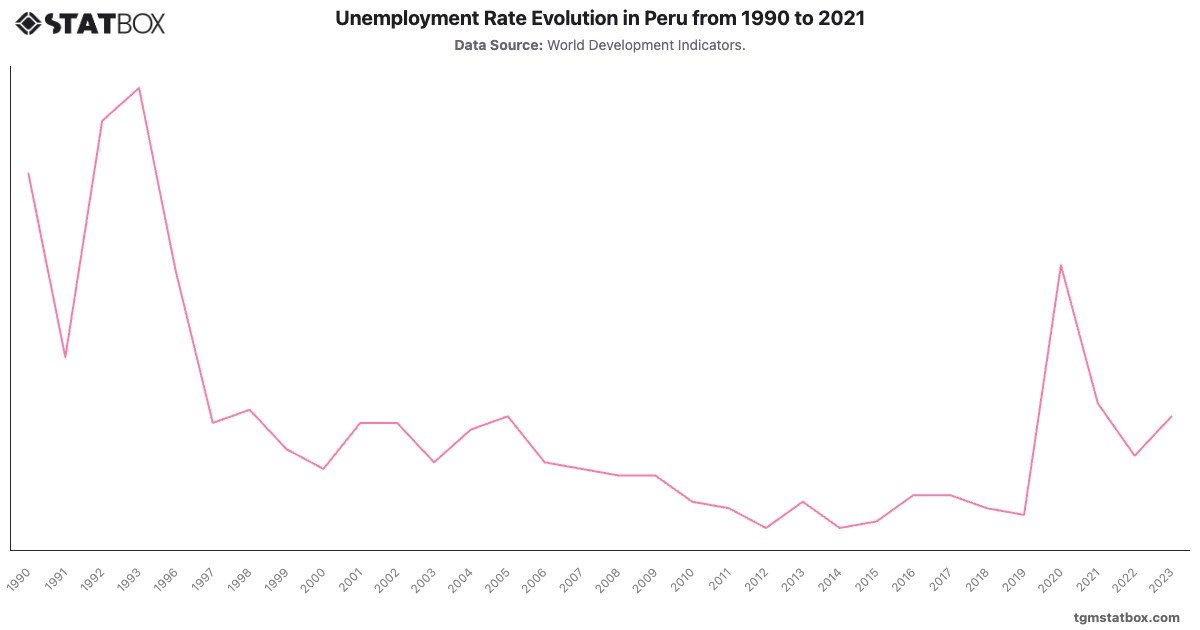
Peru’s unemployment rate has varied significantly, beginning at in 1990 and peaking at in 1993 due to economic instability and structural adjustments. By the late 1990s, the rate declined steadily, reaching around by 2008 as Peru’s economy grew. The global financial crisis had a limited impact on Peru’s labor market, with the rate remaining low at in 2009, signaling resilience.
The pandemic, however, led to a significant rise in unemployment, peaking at in 2020 as economic activities were disrupted. Following recovery efforts, the unemployment rate dropped to by 2023, reflecting the country’s efforts to restore economic stability amid ongoing global challenges.
The pandemic, however, led to a significant rise in unemployment, peaking at in 2020 as economic activities were disrupted. Following recovery efforts, the unemployment rate dropped to by 2023, reflecting the country’s efforts to restore economic stability amid ongoing global challenges.
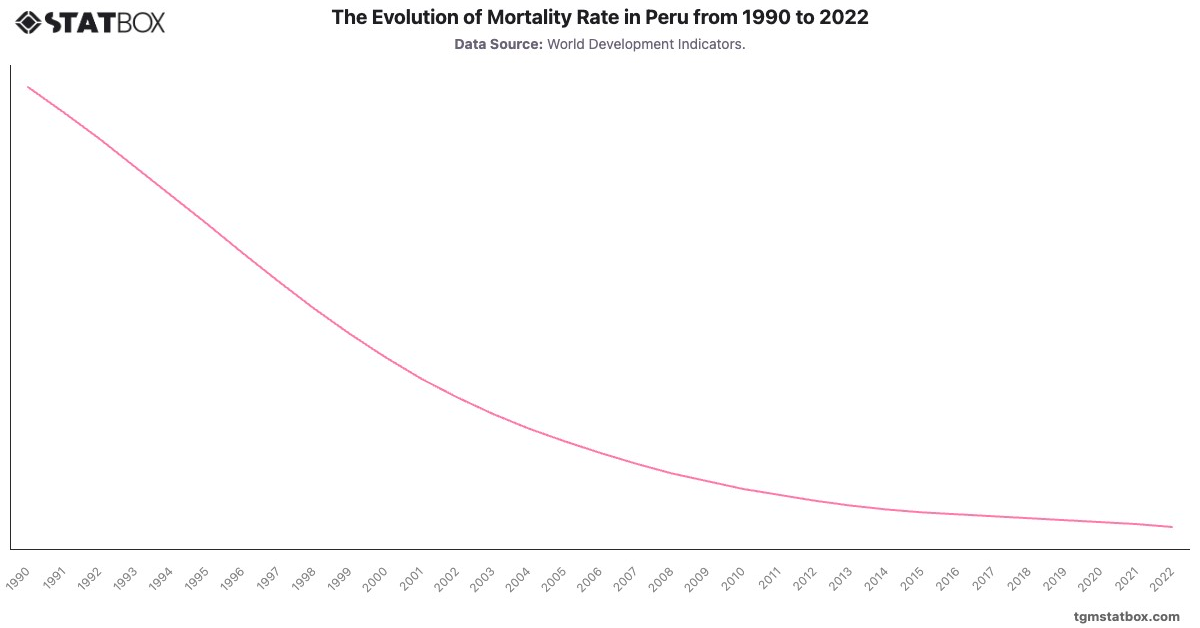
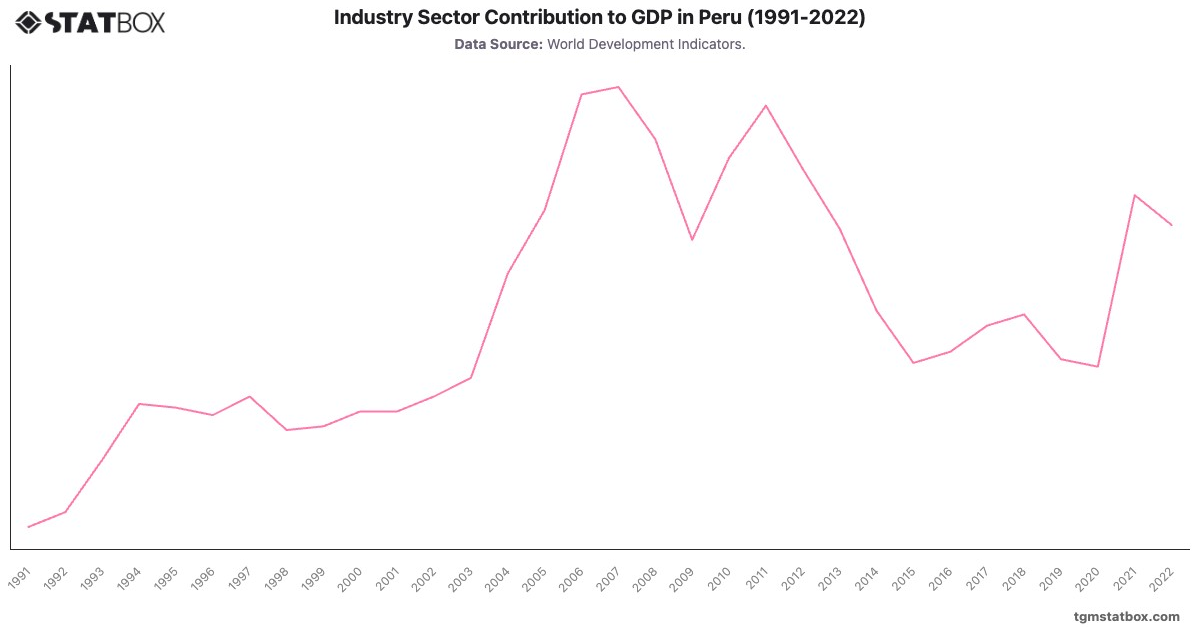
For a deeper dive into the topic, explore Fluctuating mortality rate in Peru, Peru’s mortality rate trend, industry’s share in Peru’s GDP.