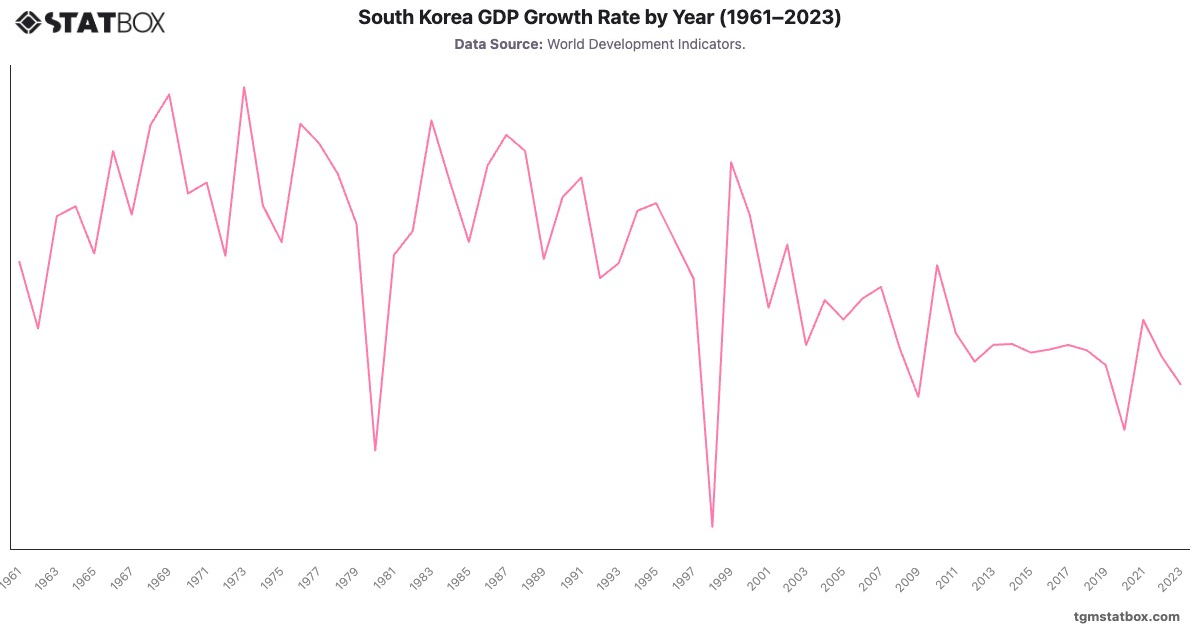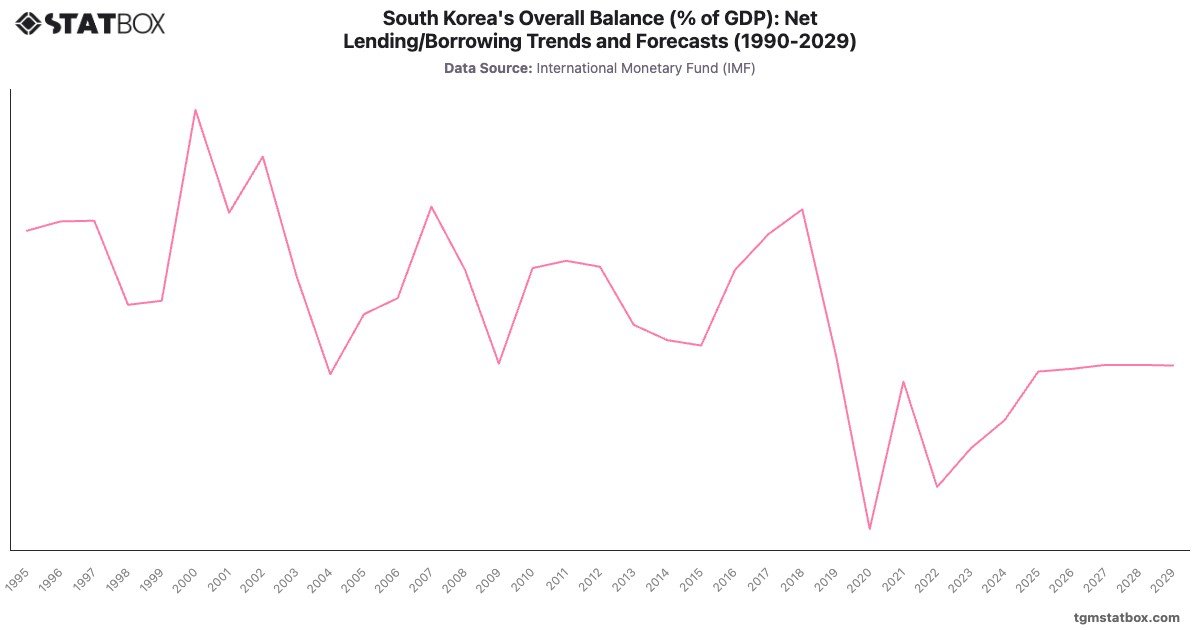
South Korea’s fiscal trends reflect its strong economic fundamentals. The late 1990s saw surpluses, peaking at in 2000, supported by rapid industrialization and export-led growth. The 2008 financial crisis and the pandemic caused temporary deficits, with a peak of - in 2020.
Projections for 2029 suggest a modest surplus of , underscoring South Korea’s resilience and prudent fiscal management, even amid global uncertainties.
Projections for 2029 suggest a modest surplus of , underscoring South Korea’s resilience and prudent fiscal management, even amid global uncertainties.
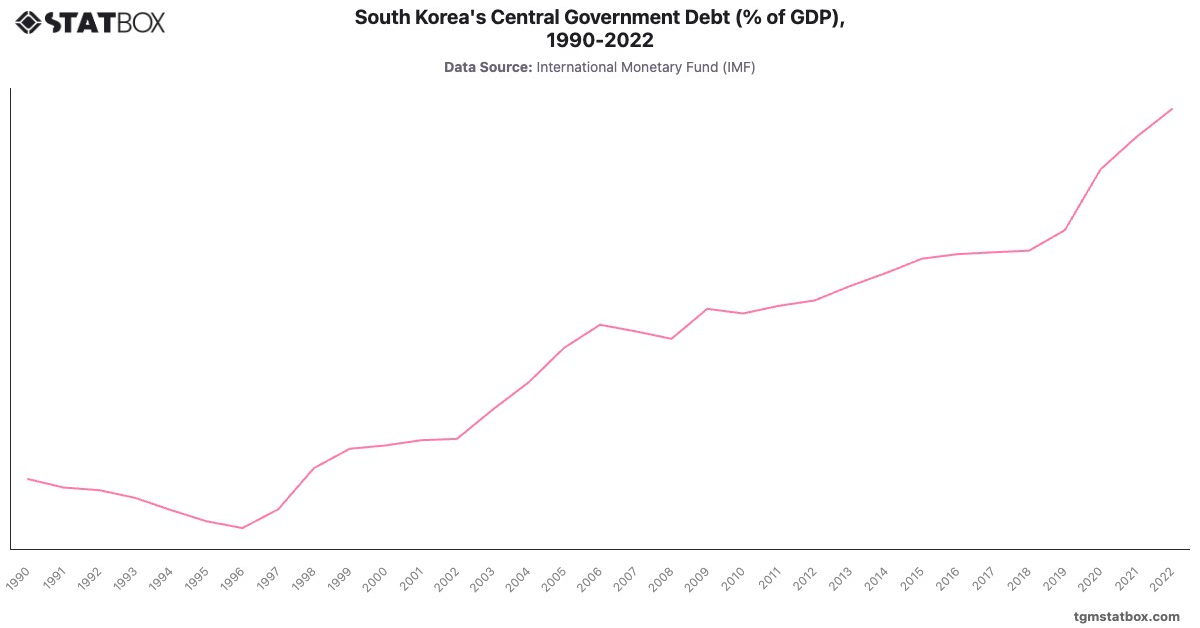
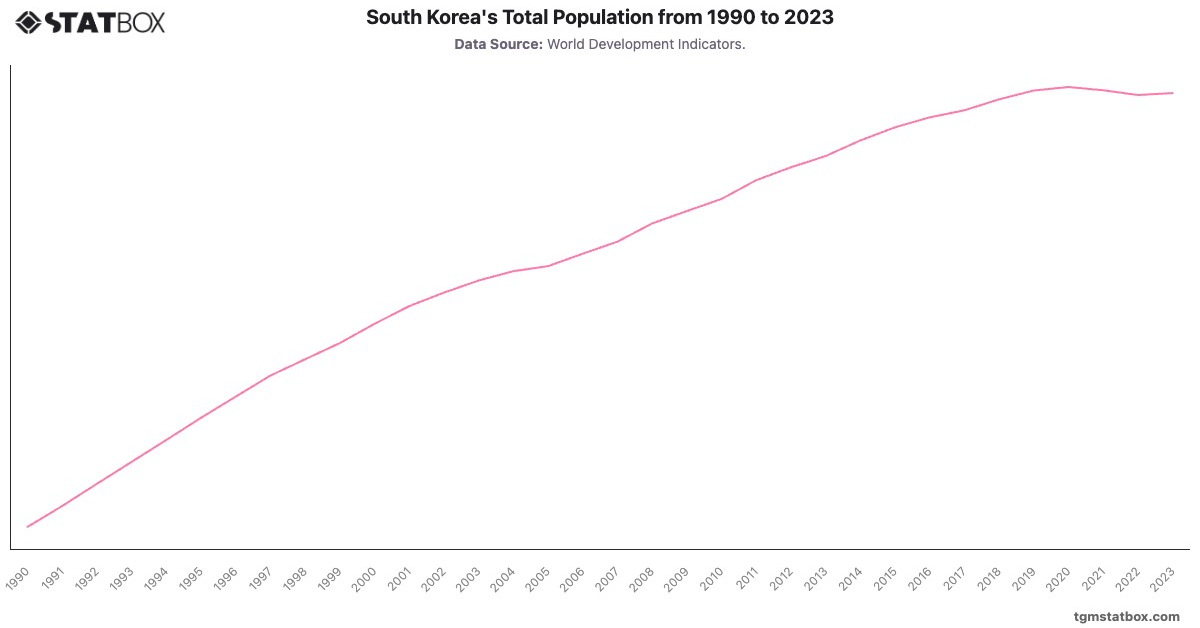
Gain a broader perspective by reviewing South Korea’s government debt to GDP ratio, South Korea’s population numbers, South Korea’s central government debt-to-GDP ratio.