Insights library
Not sure where to start? Dive into a diverse selection of charts and data visualizations across topics, and find the information you need to drive your research and analysis.
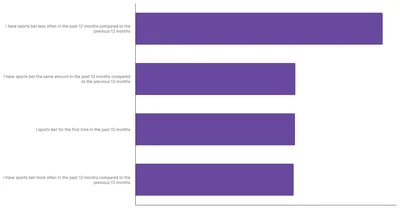

Track changes in betting habits among Ukrainians, focusing on shifts in preferences and activities over time with this TGM Statbox chart.
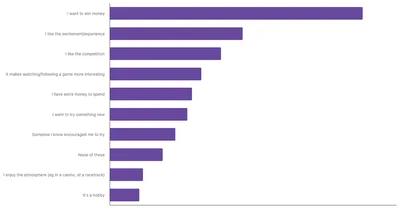
In Argentina, the primary motivation for sports betting is the desire to win money, with 57.32% of respondents citing this as their main reason.
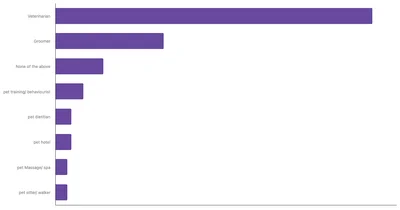
In Italy, pet owners predominantly utilize veterinarian services, with 79% of respondents indicating use. This reflects a strong commitment to ensuring pet health and well-being.
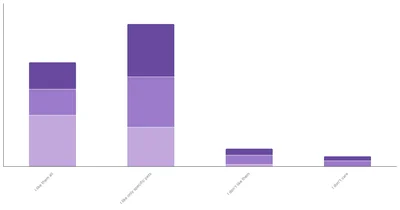
Explore attitudes toward pets in Ghana by age and gender, including differences in pet preferences across age groups and between men and women on TGM StatBox.
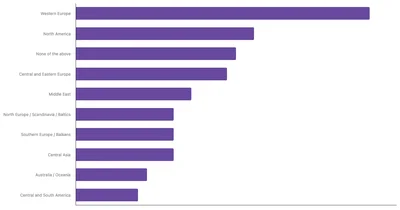
Turkish travelers are keen on Western Europe, with a third planning trips there. Additionally, 20% are looking to North America, reflecting a thirst for exploration.
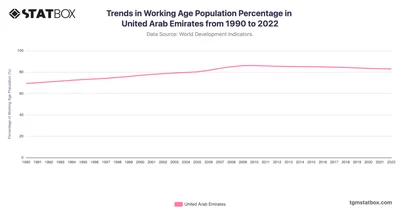
The UAE’s working-age population showed a significant upward trend from 1990 to 2009, beginning at 69%, reaching a peak of 86% in 2010. Discover more on TGM StatBox.
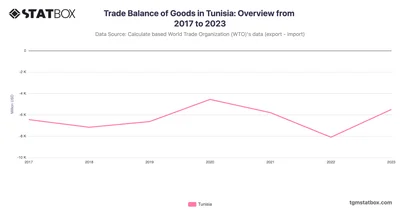
Tunisia’s trade deficit narrowed in 2023 as textile and phosphate exports recovered. Discover more statistics and insights on TGM StatBox.
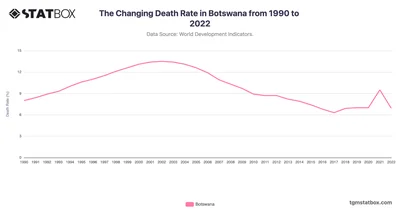
Uncover Botswana's evolving death rate, shaped by advancements in healthcare and regional challenges. Discover more statistics and insights on TGM StatBox.
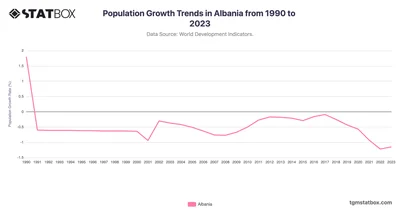
The chart illustrates the Albania's shift from positive to negative growth rates, highlighting demographic challenges. Discover how Albania has been growing on TGM StatBox.
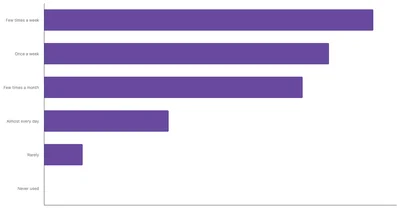
Brazil leads LATAM in food delivery use, with 71% ordering weekly—the region’s highest rate—showing strong user engagement across all frequency levels.
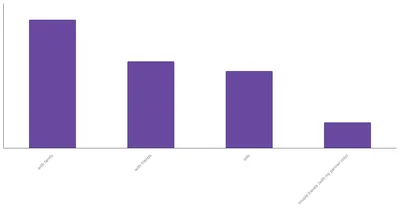
Forty percent of Nigerians travel with family, lower than in the UAE and Vietnam. Additionally, 27% travel with friends, while only 8% travel with partners.
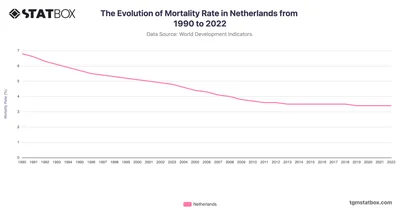
Netherlands’ mortality rate dropped from 6.8 in 1990 to 3.4 in 2022, driven by its robust healthcare system. Discover more statistics and insights on TGM StatBox.
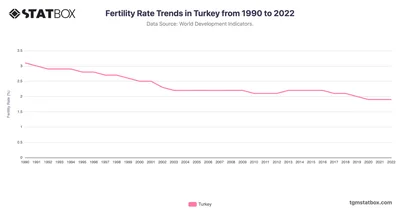
Discover Turkey's fertility trends from 1990 to 2022, reflecting population growth and socio-economic factors. Discover more statistics and insights on TGM StatBox.
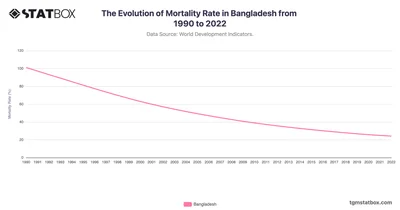
Bangladesh saw its mortality rate drop sharply from 101.1 in 1990 to 24.1 in 2022, driven by public health initiatives. Discover more statistics on TGM StatBox.
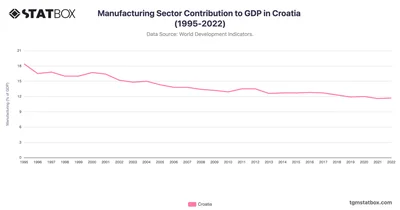
Croatia’s manufacturing sector started with a high contribution of 18.4% in 1995, which declined following its transition towards a service-oriented economy.
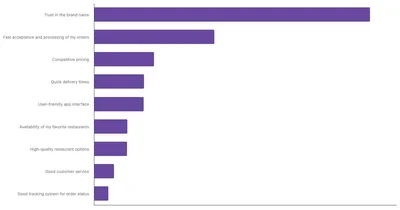
UK users choose food delivery apps for brand trust, fast order processing, and competitive pricing, with user-friendly interfaces and quick delivery as secondary factors.
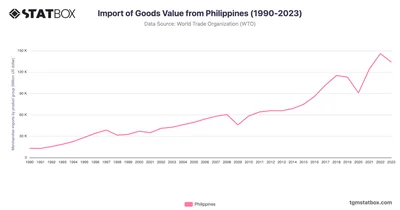
Philippines’ imports climbed from $13B in 1990 to $145.8B in 2022, highlighting industrial and consumer growth. Discover more statistics and insights on TGM StatBox.
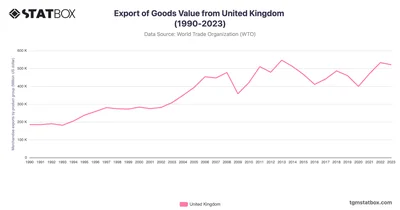
Examine the UK's export performance from 1990 to 2023, highlighting its services and industrial goods. Discover more statistics and insights on TGM StatBox.
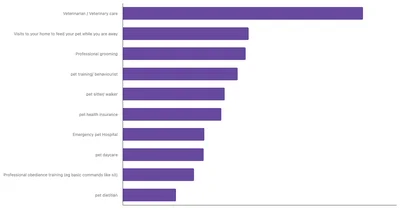
Veterinary care is the most commonly used service in South Africa, with 52.65% of respondents relying on it. Professional grooming follows closely at 26.95%.
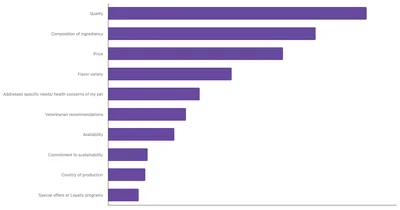
When choosing pet food, quality is the top priority for 23.32% of Polish respondents, while 18.72% emphasize the importance of ingredient composition.
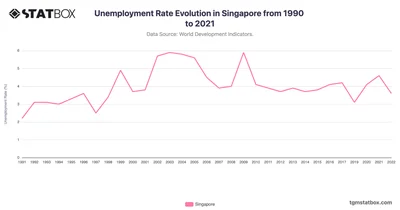
Singapore’s unemployment rate has remained relatively low over the decades. Discover more Singapore’s statistics and insights on TGM StatBox.
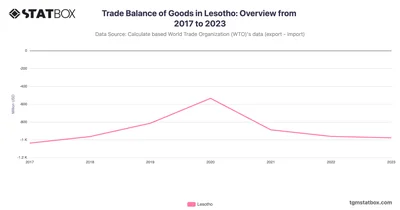
Lesotho’s consistent trade deficits highlight its reliance on imported goods despite textile export efforts. Discover more statistics and insights on TGM StatBox.
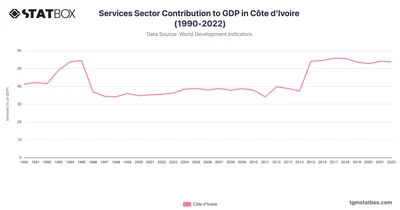
Côte d'Ivoire’s Services sector contribution grew markedly, from 41.2% in 1990 to over 55% by 2018. Find more Ivory Coast's GDP data over the years on TGM StatBox.
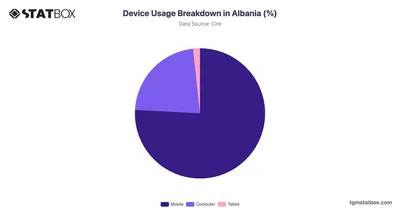
In Albania, mobile devices dominate the digital landscape with a usage rate of 75.86%. Discover more about device usage breakdown in Albania, on TGM StatBox.
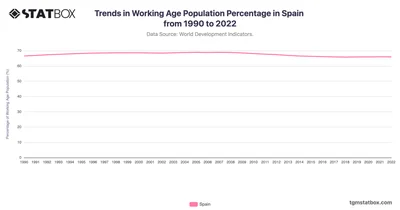
Spain's working-age population percentage rose steadily from 66.5% in 1990 to peak at 68.9% in 2007. Discover the complete data on Spain's population on TGM StatBox.
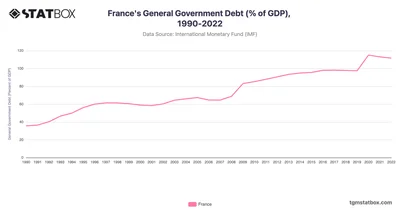
France’s debt-to-GDP ratio rose steadily from the early 1990s, starting at 35.6% in 1990 and climbing to 56.1% by 1995. Discover more statistics on TGM StatBox.
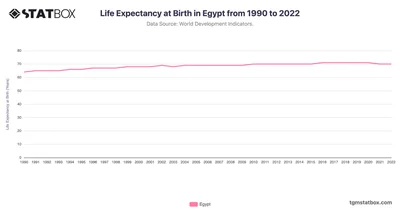
Egypt’s life expectancy rose from 64 in 1990 to 71 in 2022, highlighting public health initiatives and healthcare access. Discover more statistics and insights on TGM StatBox.
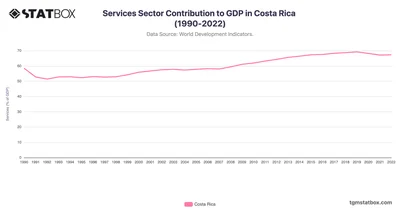
Costa Rica’s services sector saw a robust increase, rising from 58.5% in 1990 to 69.2% by 2019. Find more Costa Rica’s GDP data over the decades on TGM StatBox.
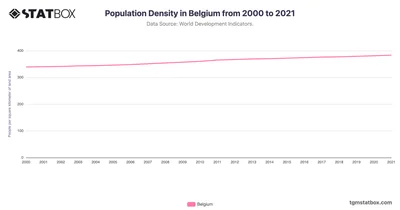
Belgium, with one of the highest population densities in Europe, saw its density increase from 339 people per square kilometer in 2000 to 383 in 2021.
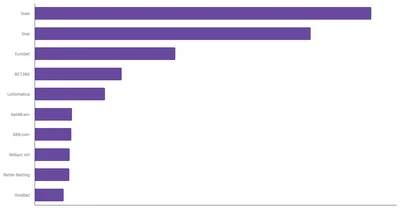
In Italy, Sisal emerges as the most recognized online betting platform, with 18.6% of respondents identifying it as the top choice.






