Insights library
Not sure where to start? Dive into a diverse selection of charts and data visualizations across topics, and find the information you need to drive your research and analysis.
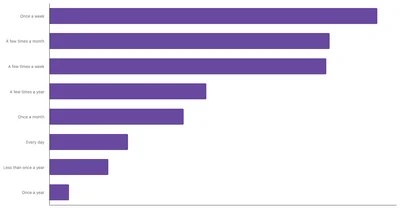

In Italy, the most common frequency is betting once a week, with 24.57% of respondents reporting this habit, followed closely by 21% who bet a few times a month.
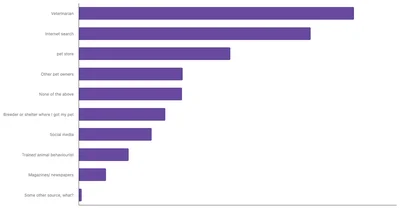
In Tunisia, pet owners primarily rely on veterinarians for guidance on proper pet care, with 47.63% of respondents indicating this as their main source of information.
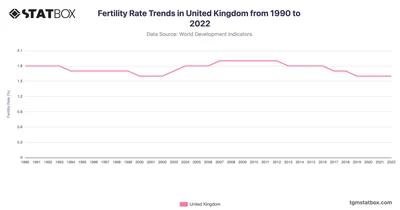
Explore the UK’s fertility trends from 1990 to 2022, showcasing demographic shifts in a modernized economy. Discover more statistics and insights on TGM StatBox.
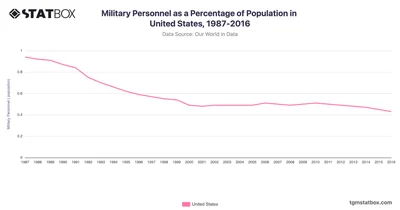
In the United States, military personnel as a percentage of the population showed a steady decline to 0.4% by 2016. Discover data on the USA’s military personnel share on TGM StatBox.
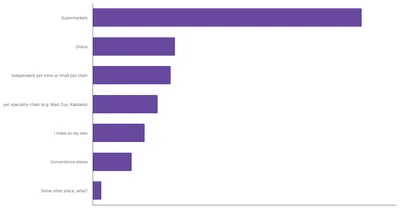
Online platforms account for 19% of pet food purchases in Australia, reflecting the growing reliance on e-commerce for convenience and competitive pricing.
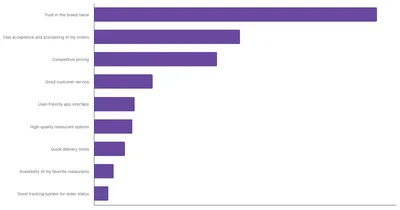
In Indonesia, food delivery app preferences are shaped by a clear set of priorities, starting with brand trust, which leads as the top reason for app choice.
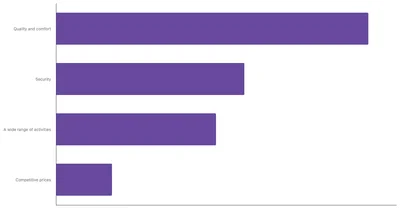
Turkish tourists prioritize quality and comfort, with 78% citing it as their top requirement. Security is also important, with 47% valuing it.
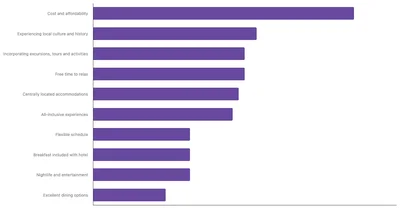
Italians prioritize cost and affordability when planning their international trips, with 43% considering this factor crucial.
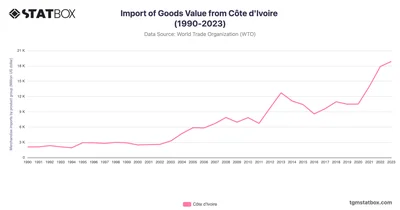
Côte d'Ivoire's imports rose from $2.1B in 1990 to $18.9B in 2023, fueled by industrial and energy needs. Discover more statistics and insights on TGM StatBox.
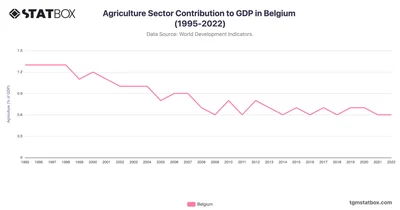
Belgium’s agriculture GDP remains minimal, balancing exports amid service growth. Discover the full Belgium’s agriculture GDP data at TGM StatBox.
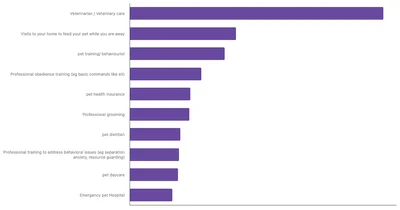
In Nigeria, pet owners tend to prioritize veterinarian or veterinary care services, with 61.8% of respondents selecting this option.
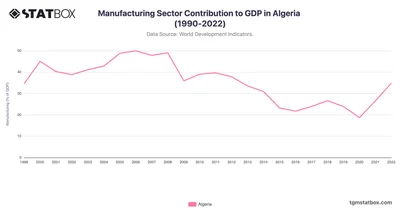
The manufacturing sector in Algeria experienced notable fluctuations from 1999 to 2022, with a high of 49.9% in 2006. See more Algeria’s data on TGM StatBox.
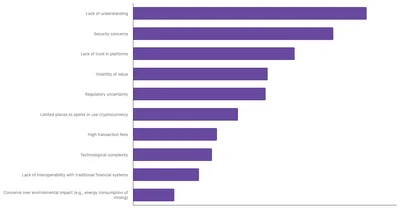
Lack of understanding is the biggest barrier to cryptocurrency adoption worldwide, with 48.8% of people citing it over concerns like security, regulation, and volatility.
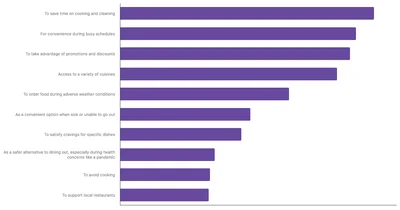
In Thailand, people use food delivery apps mainly to save time, avoid cooking, and enjoy convenience. Deals, variety, and bad weather also boost their usage.
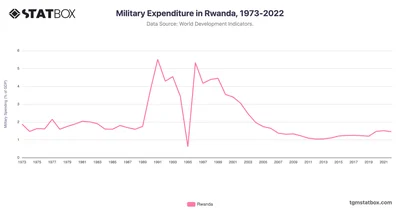
Rwanda's military spending steadied at 1.4% by 2022 amid stability goals. Explore more statistics and insights on TGM StatBox.
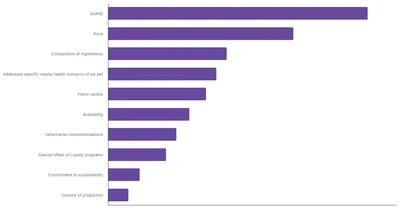
The three most important factors for Austrian pet owners when choosing pet food are quality, price, and the composition of ingredients.
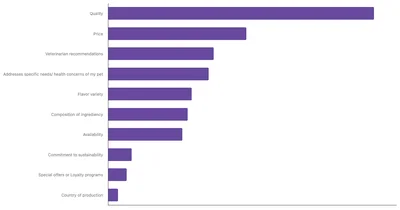
South African pet owners prioritize several key factors when selecting pet food, with quality emerging as the most important consideration at 29.49%.
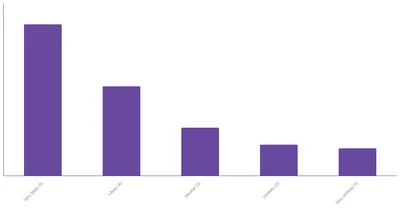
69.5% of English respondents are likely or very likely to travel overseas within the next year, with 43.64% being very likely, surpassing the global average.
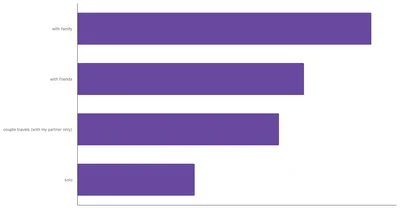
In South Africa, family is the primary travel companion, with 35% of respondents indicating they most often travel with their relatives.
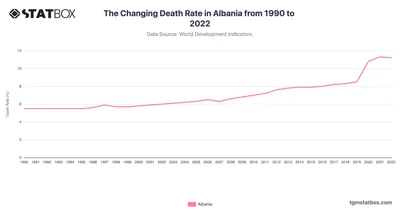
Explore Albania’s death rate trends shaped by healthcare progress and demographic changes. Discover more statistics and insights on TGM StatBox.
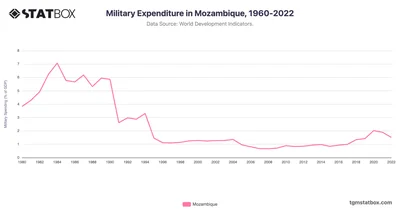
Mozambique's military spending as a percentage of GDP saw significant fluctuations from 1980 to 2022, reflecting the country's political and economic transitions.
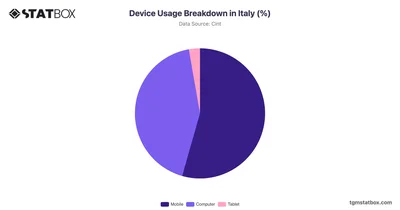
Discover the detailed breakdown of device usage in Italy, with percentage insights into the prevalence of smartphones, tablets, and desktops in daily life.
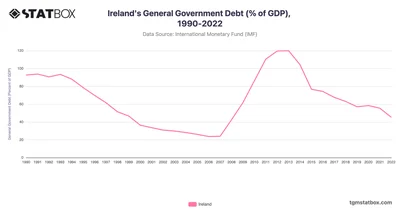
Ireland’s debt-to-GDP ratio declined significantly to a low of 23.6% in 2006, reflecting the benefits of robust economic growth. Discover more statistics on TGM StatBox.
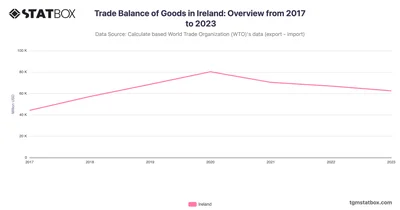
Ireland’s trade surplus softened in 2023 but remained supported by strong pharmaceutical exports. Discover more statistics and insights on TGM StatBox.
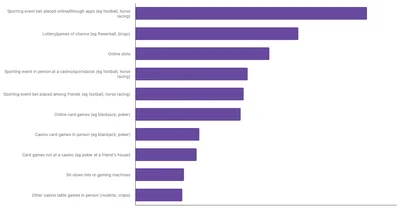
Explore the most common betting activities in the United Kingdom, including popular sports and casino games, through this detailed TGM Statbox chart.
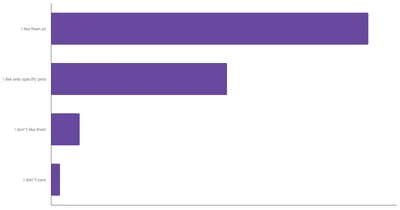
The majority of Indian respondents (59.72%) express a positive sentiment, stating that they "like them all". A significant portion indicate that they "like only specific pets".
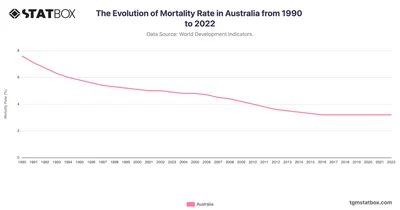
Australia’s mortality rate dropped from 7.6 in 1990 to 3.2 in 2022, reflecting effective healthcare and public health strategies. Discover more insights on TGM StatBox.
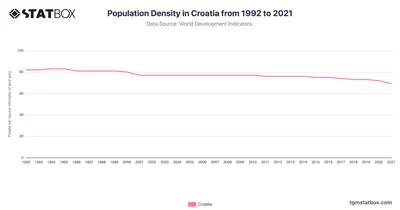
Croatia’s population density fluctuated between 82 and 77 people per square kilometer from 1992 to the early 2000s. Discover Croatia’s population density data on TGM StatBox.
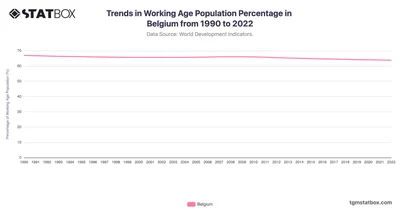
In Belgium, the working-age population showed a gradual decline from 66.9% in 1990 to 63.7% in 2022. Discover complete data of Belgium on TGM StatBox.
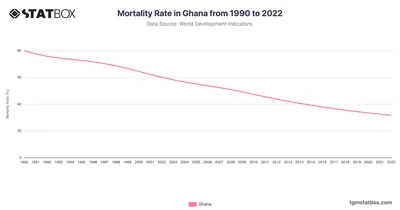
Ghana’s mortality rate fell from 80.0 in 1990 to 31.6 in 2022, reflecting successful public health campaigns and improved healthcare access. Discover more insights on TGM StatBox.






