Insights library
Not sure where to start? Dive into a diverse selection of charts and data visualizations across topics, and find the information you need to drive your research and analysis.
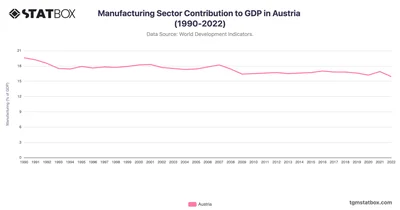
Austria's manufacturing sector maintained stability from 1990 to the early 2000s, starting at 19.6% in 1990 and holding near 18% until 2009. See more data on TGM StatBox.
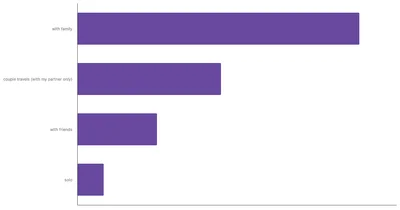

In Spain, the most common travel companions are family members, with 53% of Spaniards indicating they prefer to travel with their families.
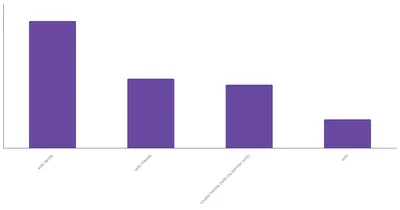
Traveling with friends is popular among Italians, with 24% choosing this option, significantly higher than the global average.
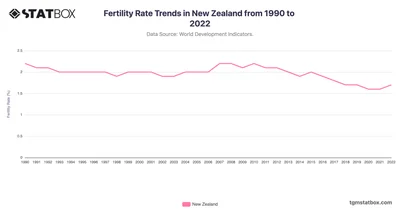
Explore New Zealand's fertility rates from 1990 to 2022, reflecting stable growth in a dynamic economy. Discover more statistics and insights on TGM StatBox.
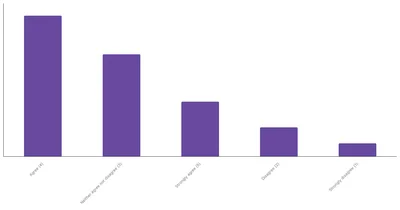
Engagement with Sports Betting Content in Peru | TGM Statbox Chart: Explore the level of engagement with sports betting content in Peru through TGM Statbox.
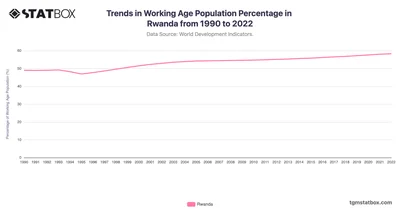
Rwanda's working-age population percentage exhibited a steady upward trend from 1990 to 2022, reflecting the country’s demographic shifts and economic transformation.
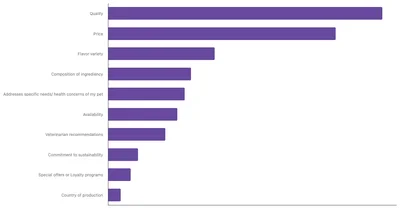
According to the data, quality is the foremost concern, with 28.53% of respondents emphasizing it as a critical factor.
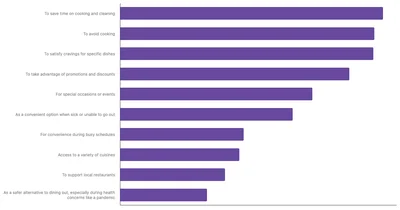
Whether it’s satisfying cravings, skipping cooking altogether, or saving time on daily tasks like meal prep and cleaning, users turn to these services to make life easier.
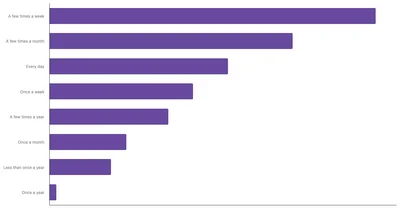
The most common frequency is betting 'a few times a week,' reported by 28.2% of Indian respondents, followed by 21% who bet a few times a month.
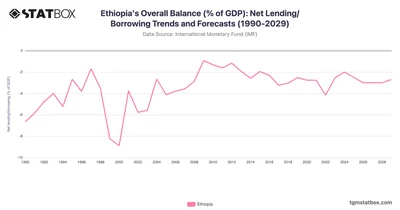
Ethiopia’s fiscal trends reflect developmental spending and economic growth, with gradual deficit narrowing forecast. Discover more statistics and insights on TGM StatBox.
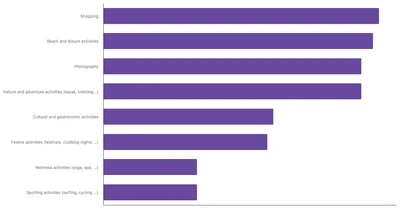
In the UAE, shopping ranks as the most popular travel activity, with 47% of Emiratis selecting it as a top pursuit, followed closely by beach and leisure activities.
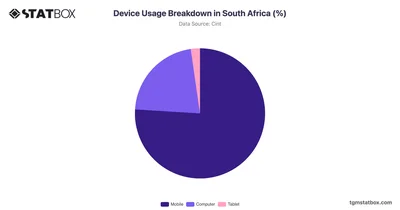
South Africa exhibits a strong preference for mobile devices, with 75.97% of users relying on them. Discover more about device usage breakdown on TGM StatBox.
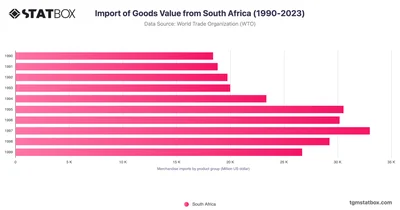
South Africa’s imports rose from $18.3B in 1990 to $136.2B in 2022, reflecting industrial and consumer demand. Discover more statistics and insights on TGM StatBox.
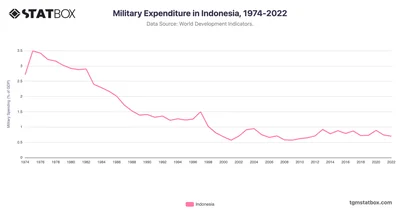
Indonesia's military spending rose to 0.9% by 2020, focusing on modernization. Find more statistics and insights on TGM StatBox.
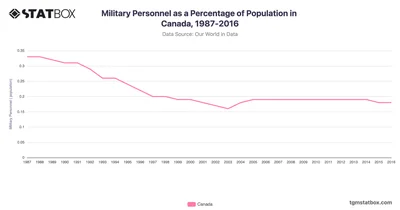
Canada’s military personnel percentage remained steady 1987 through 1994 before stabilizing from 1995 onwards. Discover Canada’s data on TGM StatBox.
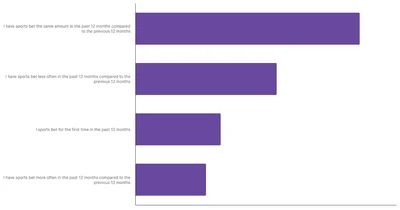
While 42.96% of Austrian respondents reported betting the same amount as the previous year, 13.57% indicated an increase in their sports betting frequency.
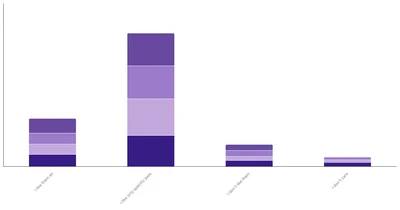
Around 60-67% of respondents across all age groups between 18-54 years old prefer specific pets rather than all animals, while roughly 20-27% express affection for all pets.
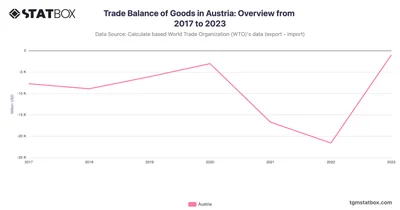
Austria’s trade deficit narrowed sharply in 2023, driven by export recovery in machinery and automotive goods. Discover more statistics and insights on TGM StatBox.
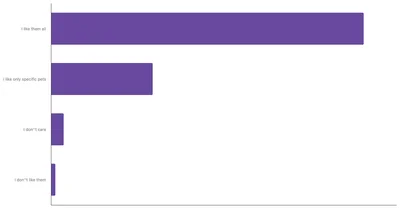
72.43% of Polish respondents expressing a fondness for all types of pets. This positive sentiment is notably higher than in many other countries like Nigeria or Chile.
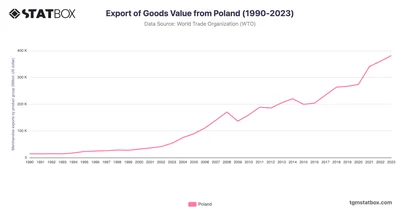
Examine Poland's export journey from 1990 to 2023, showcasing its integration into European trade. Discover more statistics and insights on TGM StatBox.
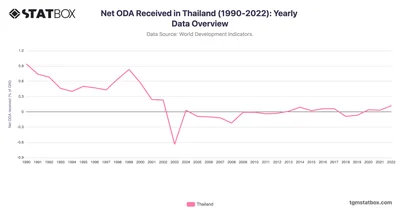
Thailand’s Net ODA fell from 0.9% in 1990 to near-zero post-2003 as it transitioned to donor status. Discover more statistics and insights on TGM StatBox.
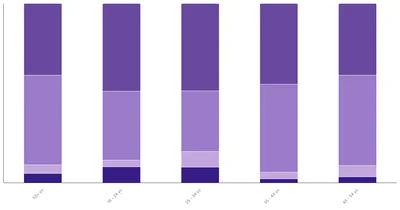
Colombian women show a higher general affinity for pets, with 48.8% liking all pets compared to 41.39% of men. Men are more likely to like specific pets than women.
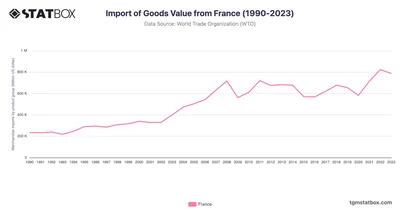
France’s imports climbed from $234.4B in 1990 to $823.2B in 2022, highlighting its diverse and mature economy. Discover more statistics and insights on TGM StatBox.
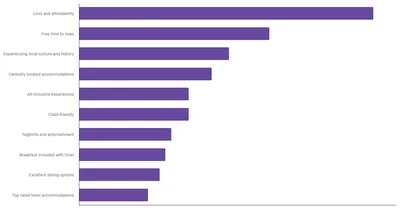
The most significant consideration is cost and affordability, with 51% of respondents emphasizing budget-friendly options.
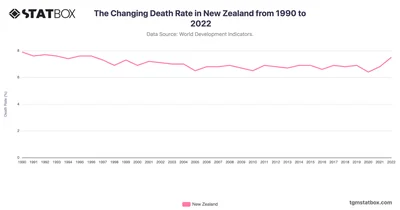
New Zealand’s death rate trends reflect healthcare gains and aging population dynamics. Discover more statistics and insights on TGM StatBox.
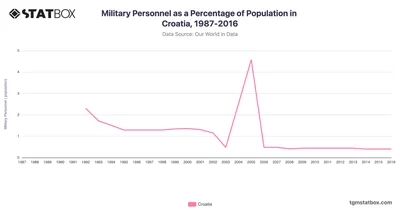
Croatia's military personnel as a percentage of the population experienced significant fluctuations during the 1990s. Discover data on Croatia's military personnel share on TGM StatBox.
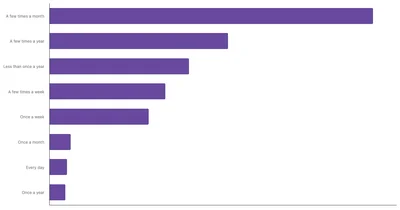
Analyze the frequency of casino gambling among Singaporeans with this TGM Statbox chart, offering data on the popularity of casino activities.
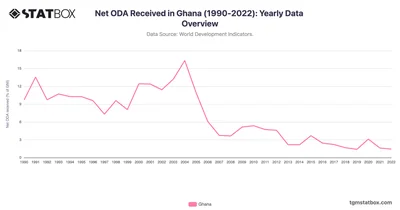
Ghana’s Net ODA peaked at 16.3% in 2004, declining to 1.4% in 2022 as oil revenues grew. Discover more statistics on TGM StatBox.
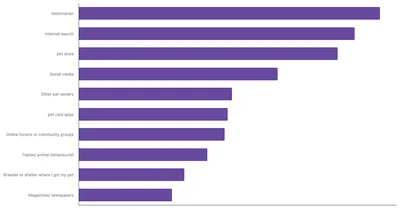
In South Africa, veterinarians serve as the primary source of pet care information (56.9%). Social media has also become an influential channel among pet owners.
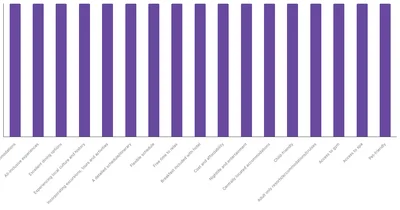
Cost and affordability stand out as the most significant consideration, with 52% of respondents emphasizing the importance of budget-friendly options.






