Insights library
Not sure where to start? Dive into a diverse selection of charts and data visualizations across topics, and find the information you need to drive your research and analysis.
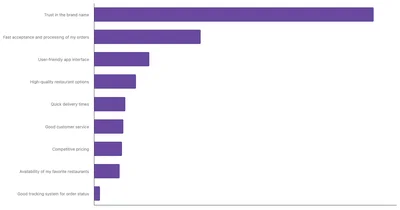

The reasons behind user loyalty start with brand trust, cited by 46.2% of users as the most important factor when choosing a food delivery app.
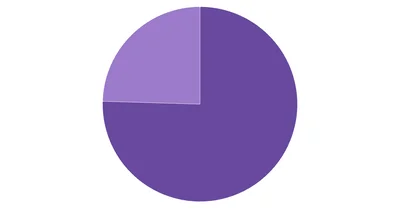
In the Netherlands, 75.5% of sports bettors prefer online platforms or mobile apps, while 24.5% opt for in-person betting at sportsbooks or casinos.
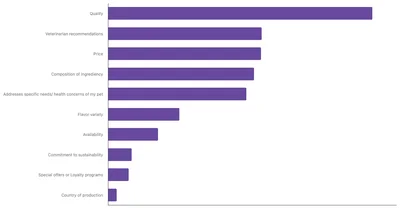
In Colombia, the top factors for choosing pet food are quality (25.65%), veterinarian recommendations (14.91%), and price (14.86%).
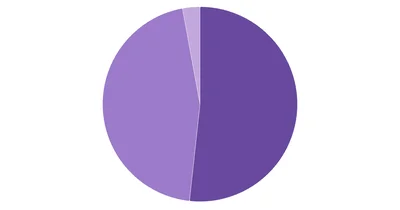
Over half of the respondents in the Philippines have used or owned cryptocurrency. This shows a clear level of familiarity and engagement with digital currencies.
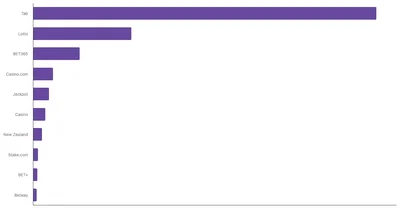
Leading Online Betting Platforms in New Zealand | TGM Statbox Chart: Discover the leading online betting platforms in New Zealand with TGM Statbox's detailed chart.
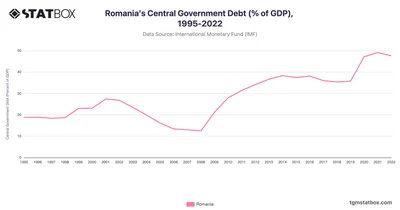
Romania’s debt hit 49.09% in 2021, stabilizing at 47.63% by 2022 amid recovery efforts. Discover fiscal trends, statistics and insights on TGM StatBox.
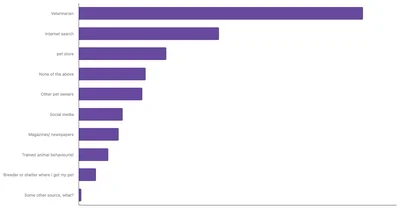
Veterinarians serve as Italy's primary pet care advisors, consulted by 62.64% of owners, while digital resources and pet stores serve as supplementary information channels.
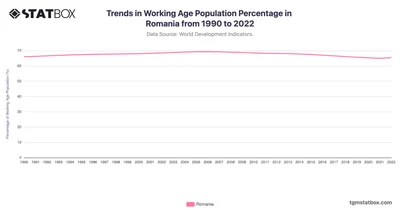
Romania saw a growth in its working-age population from 66% in 1990 to a peak of 69.3% in the mid-2000s. Discover the complete data on TGM StatBox.
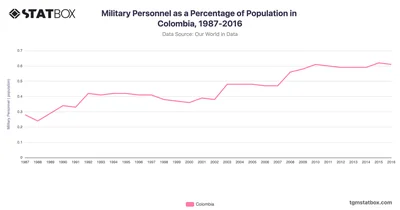
Colombia’s military personnel percentage rose from 0.3% in 1987 to a high of 0.6% from 2008 onward. Discover data on Colombia’s military personnel share on TGM StatBox.
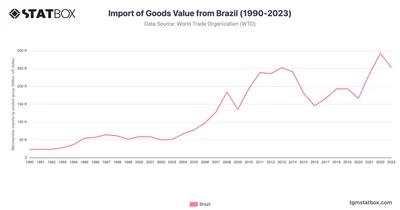
Brazil’s imports climbed from $22.5B in 1990 to $292.2B in 2022, reflecting industrial and agricultural demand. Discover more statistics and insights on TGM StatBox.
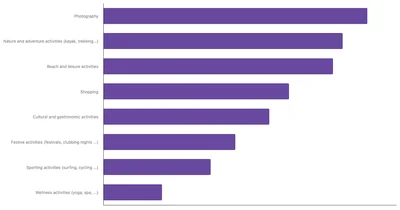
Photography is particularly popular among Filipinos, with 54% participating in it while traveling, significantly exceeding the global average.
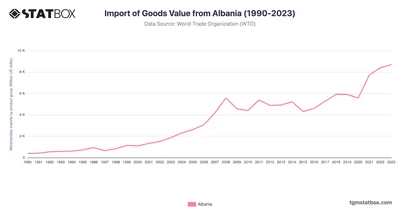
Albania's imports expanded from $380M in 1990 to $8.7B in 2023, reflecting industrial growth and global integration. Discover more statistics and insights on TGM StatBox.
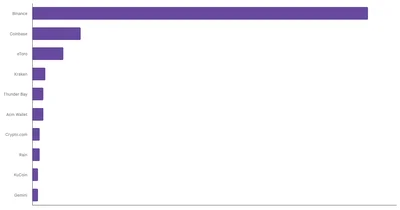
Binance dominates the UAE’s crypto exchange market, far surpassing competitors like Coinbase and eToro, which have much smaller market shares.
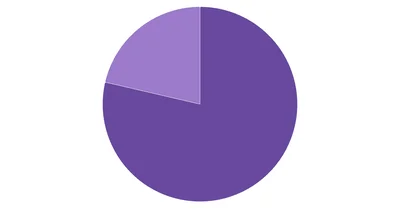
In Brazil, 78.62% of sports bettors favor online platforms or apps for convenience, while 21.38% still enjoy the social appeal of in-person betting.
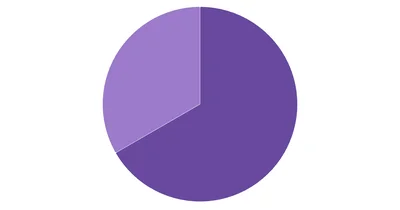
Discover the preferred betting channels in the UAE, from online platforms to physical venues, in this detailed TGM Statbox chart.
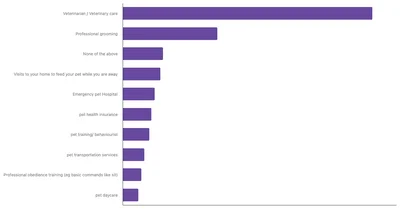
Veterinary care is the most commonly used service, with a usage rate of 77.5%. 29.4% of owners opting for professional grooming to maintain their pets' hygiene and appearance.
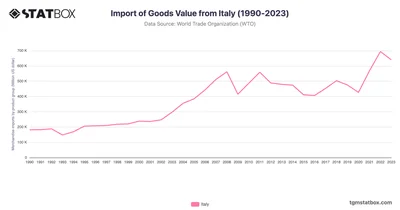
Italy’s imports expanded from $181.9B in 1990 to $694.3B in 2022, reflecting its industrial strength. Discover more statistics and insights on TGM StatBox.
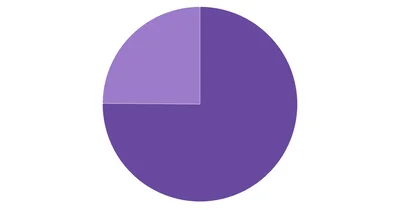
Discover the preferred betting channels in Switzerland, from online platforms to physical venues, in this detailed TGM Statbox chart.
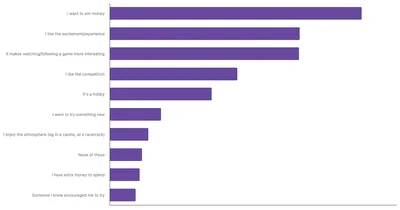
Explore the factors influencing sports betting in Serbia with TGM Statbox Charts. Discover insights into economic, social, and technological influences on betting habits.
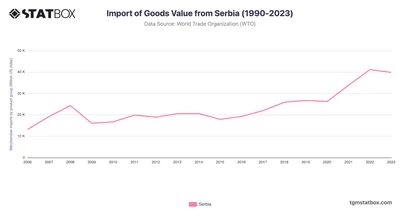
Serbia’s imports rose from $13.1B in 2006 to $41.1B in 2022, showcasing its economic recovery and growth. Discover more statistics and insights on TGM StatBox.
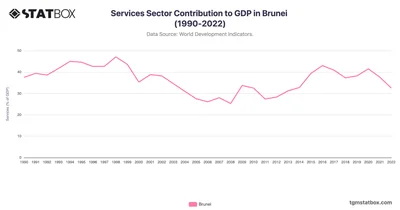
Brunei’s Services sector has shown volatility, peaking at 47.1% in 1998 before falling to 32.5% in 2022. Find more Brunei’s GDP data over the years on TGM StatBox.
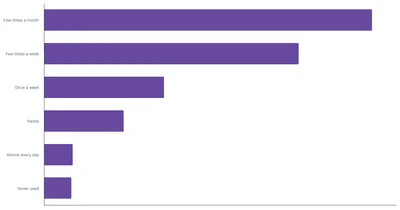
In Peru, food delivery apps are now a regular part of daily life, with 48.13% of users ordering at least once a week. Many rely on them to save time and manage busy routines.
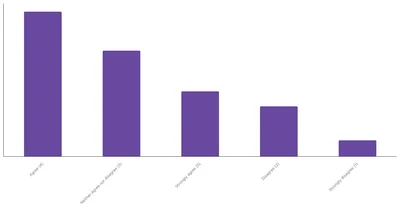
54.92% of Italians enjoy engaging with sports betting content like social media discussions, while 17.39% express a lack of interest.
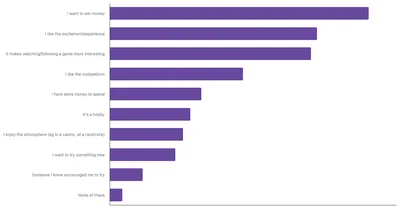
The key motivations for sports betting among the Irish are varied, with the most prominent reason being the desire to win money, cited by 58.71% of respondents.
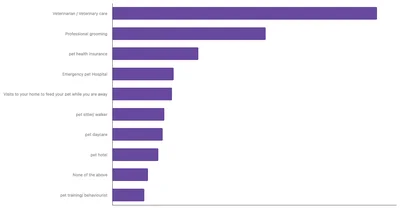
The most commonly used pet service in Ireland is veterinary care, with 65.18% of pet owners utilizing this essential service.
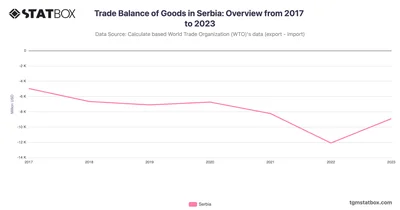
Serbia’s trade deficit narrowed in 2023 as exports of agriculture and industrial goods improved. Discover more statistics and insights on TGM StatBox.
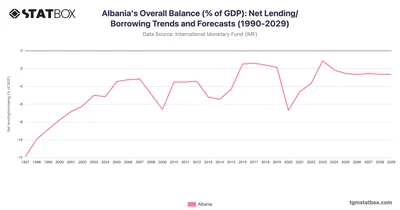
Albania’s fiscal trends reflect gradual deficit reduction despite external pressures and economic transitions. Discover more statistics and insights on TGM StatBox.
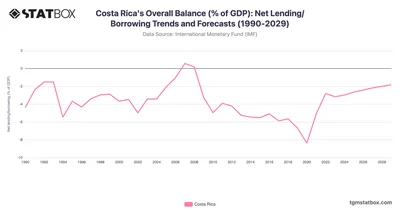
Costa Rica’s deficits show gradual narrowing, reflecting ongoing fiscal reforms. Discover more statistics and insights on TGM StatBox.
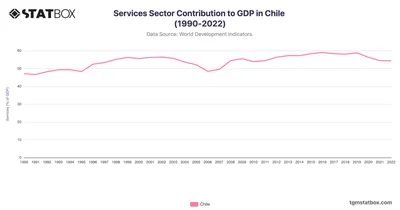
Chile’s services sector expanded from 47.1% in 1990 to 59% in 2016, fueled by gradual economic diversification beyond mining and agriculture.
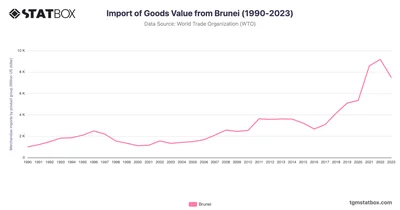
Brunei’s imports increased from $1B in 1990 to $9.1B in 2022, driven by infrastructure and energy needs. Discover more statistics and insights on TGM StatBox.






