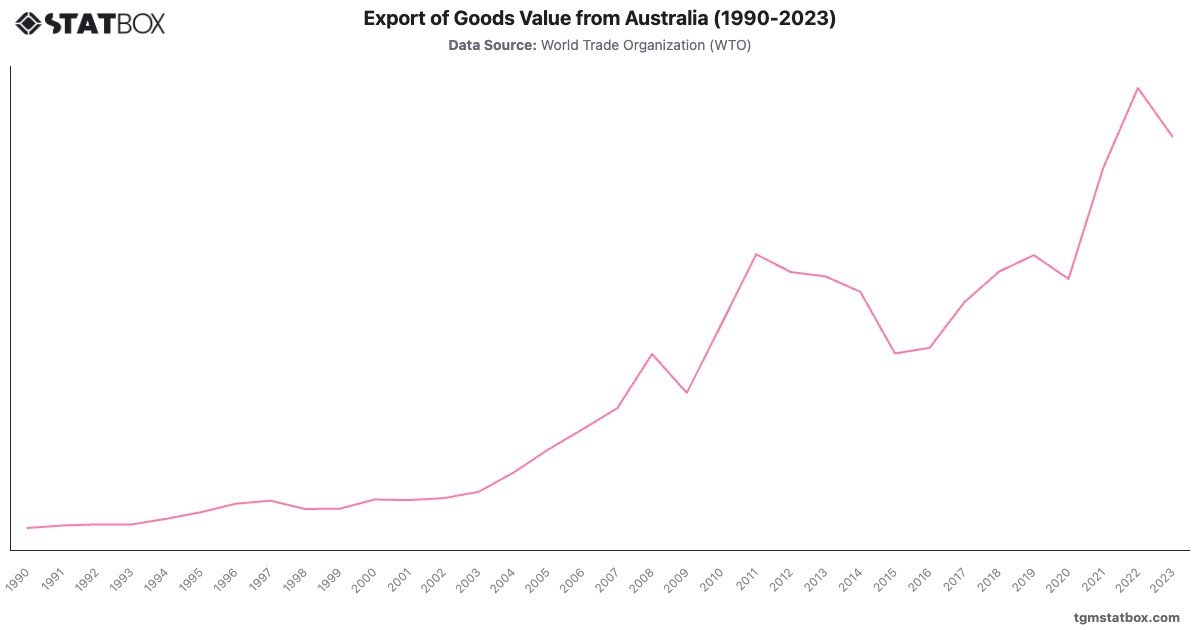
Australia's export growth underscores its resource-driven economy. Beginning at $39.8 billion in 1990, exports climbed steadily, driven by demand for minerals and energy products. By 2008, exports surged to $187.3 billion during the global commodities boom, reflecting increased demand from China.
A peak of $412.7 billion in 2022 highlighted Australia’s reliance on iron ore, coal, and LNG exports. Economic shocks, such as the 2008 financial crisis and the COVID-19 pandemic, momentarily dampened growth but were mitigated by high commodity prices and trade diversification. Export growth underscores Australia's resilience in global trade dynamics.
A peak of $412.7 billion in 2022 highlighted Australia’s reliance on iron ore, coal, and LNG exports. Economic shocks, such as the 2008 financial crisis and the COVID-19 pandemic, momentarily dampened growth but were mitigated by high commodity prices and trade diversification. Export growth underscores Australia's resilience in global trade dynamics.
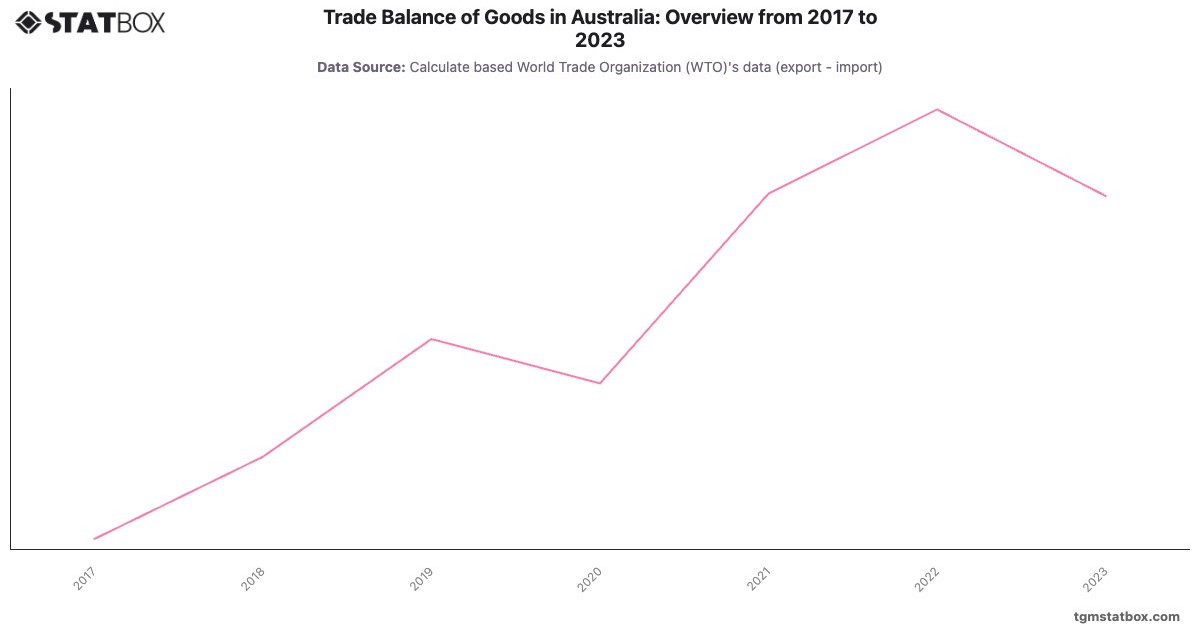
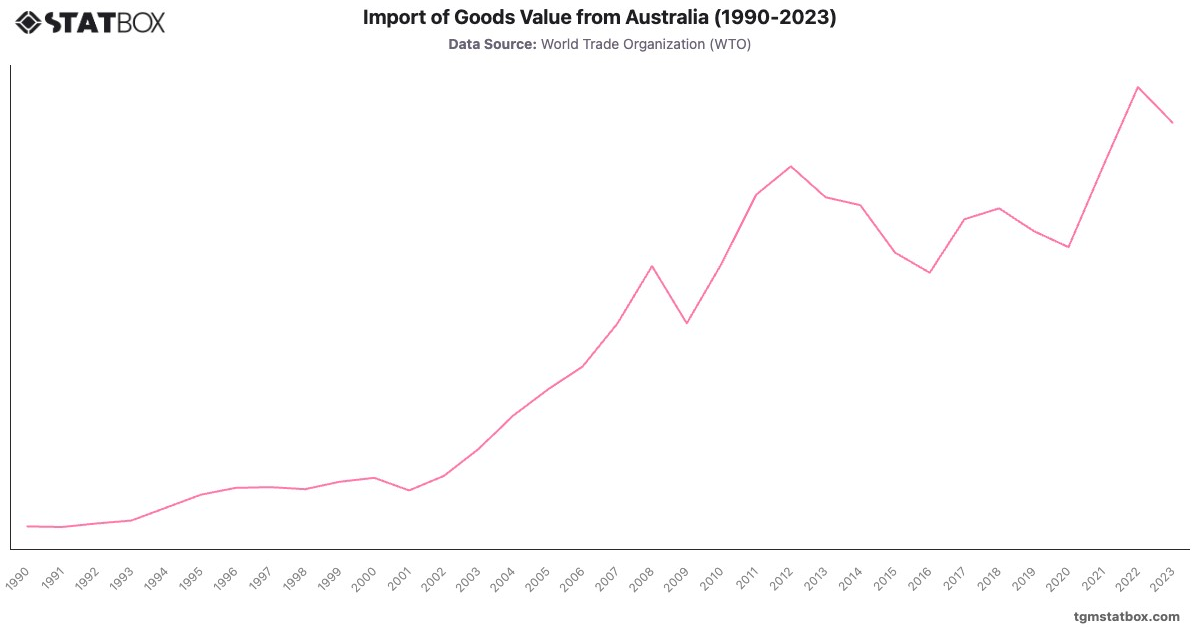
Explore related charts to gain a better understanding of Australia’s import value, Australia’s unemployment rate evolution, Australia’s goods trade balance overview.