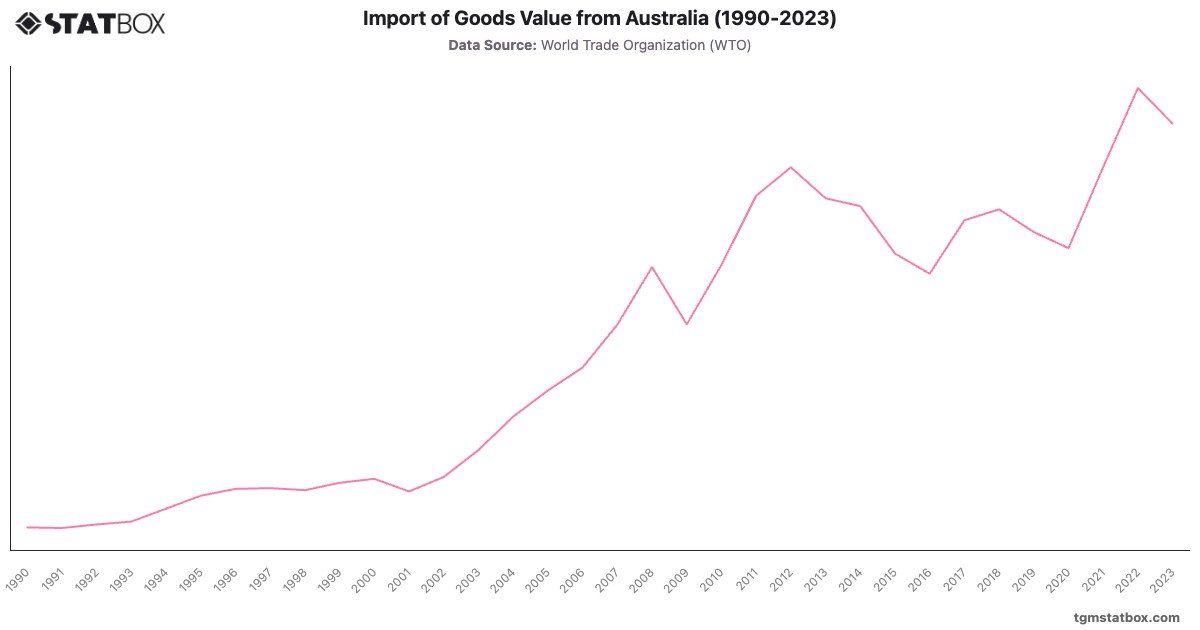
Australia's import value grew steadily from $41.9B in 1990 to $71.5B in 2000, reflecting its integration into the Asia-Pacific trade network. A significant jump to $200.3B in 2008 can be linked to strong commodity exports driving higher income and consumer spending. The global financial crisis caused a temporary dip to $165.4B in 2009.
Recovery was swift, with imports reaching $309.2B in 2022, fueled by demand for advanced machinery, consumer goods, and vehicles. The minor decline to $287.4B in 2023 highlights adjustments in response to global trade uncertainties. Australia's import trajectory showcases its role as a key player in global trade, leveraging its strong economic ties and diversified import base.
Recovery was swift, with imports reaching $309.2B in 2022, fueled by demand for advanced machinery, consumer goods, and vehicles. The minor decline to $287.4B in 2023 highlights adjustments in response to global trade uncertainties. Australia's import trajectory showcases its role as a key player in global trade, leveraging its strong economic ties and diversified import base.
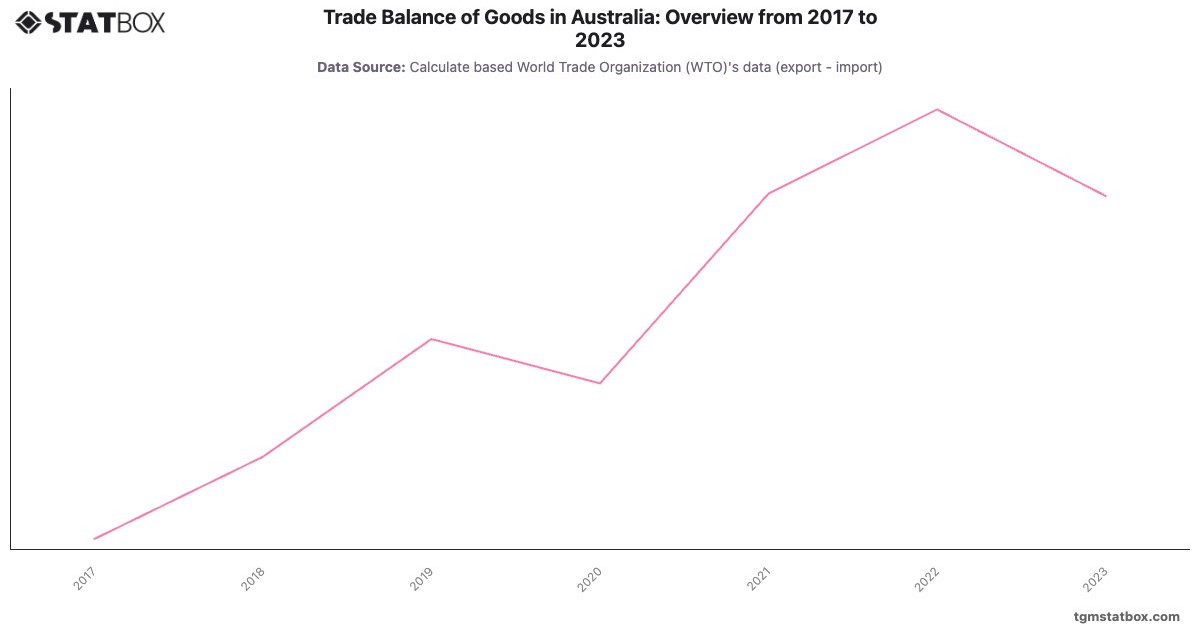
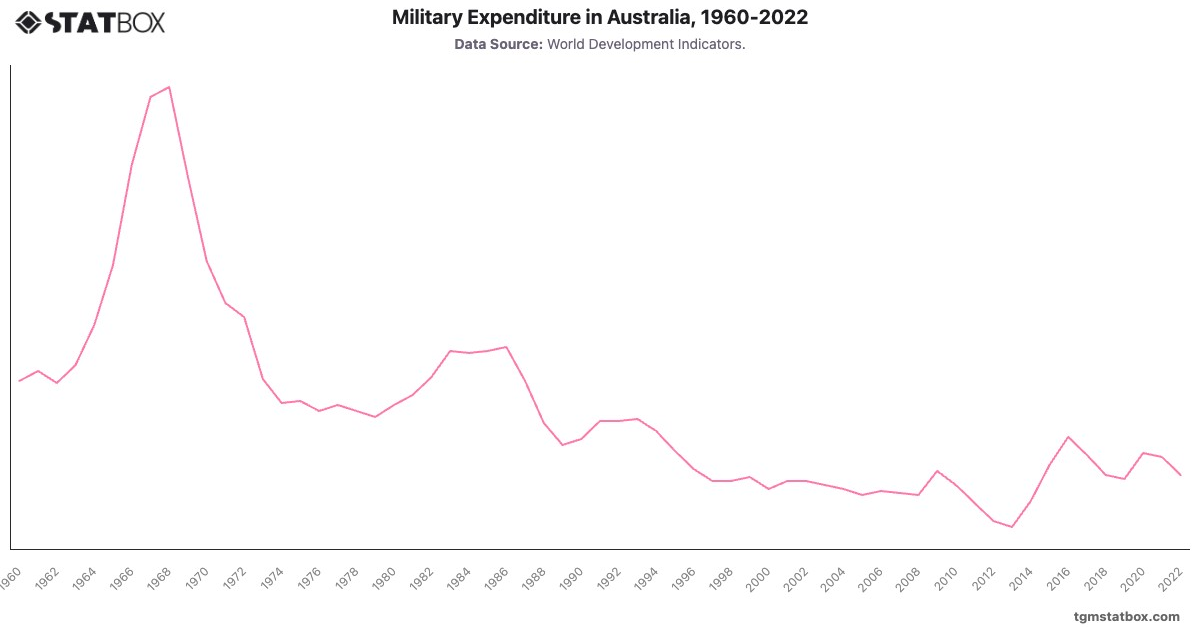
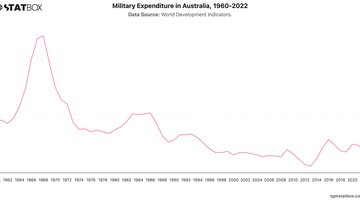
Explore related charts to gain a better understanding of Australia’s goods trade balance overview, Australia’s annual GDP growth rate, Australia’s military spending.