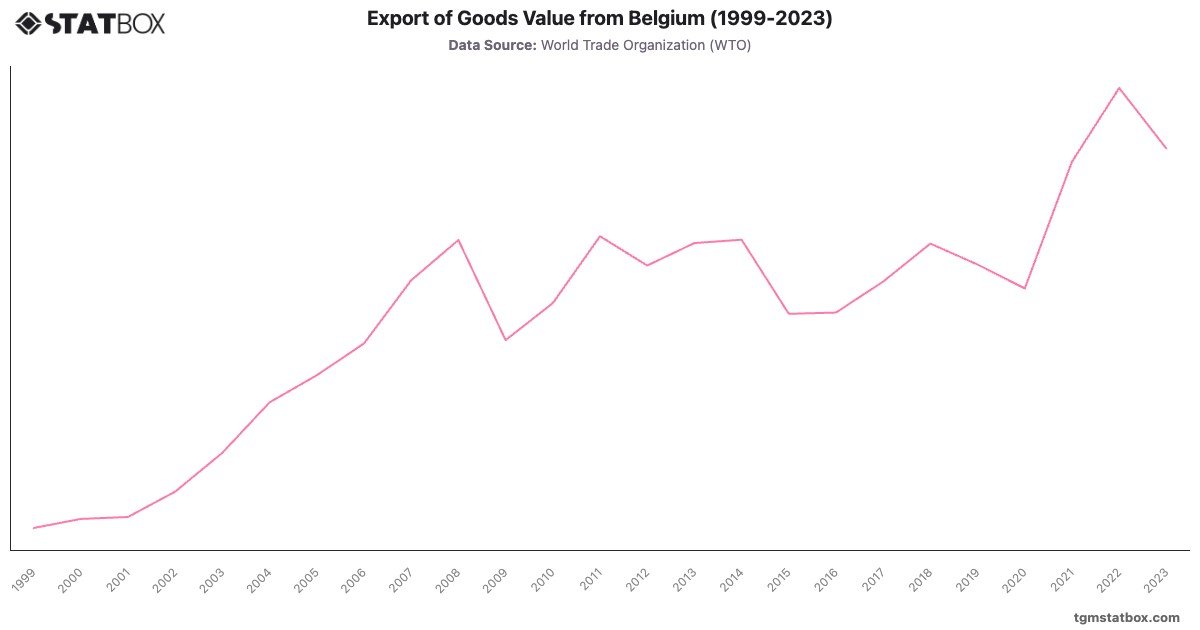
Belgium, as a major European trading hub, saw consistent growth in export value from 1999 to 2023. Exports rose from $179.2 billion in 1999 to $471.8 billion by 2008, benefiting from its strategic location and advanced logistics network. The global financial crisis in 2008 led to a decline in 2009, with exports falling to $370.1 billion. However, Belgium’s resilient industrial and pharmaceutical sectors helped exports recover, surpassing pre-crisis levels by 2011 at $475.7 billion.
Recent years saw a significant jump, reaching a peak of $626.4 billion in 2022, reflecting increased trade in machinery, chemicals, and pharmaceuticals. Although exports slightly declined to $564.8 billion in 2023, the overall upward trend highlights Belgium's adaptability in navigating global economic challenges and maintaining strong intra-EU trade relationships.
Recent years saw a significant jump, reaching a peak of $626.4 billion in 2022, reflecting increased trade in machinery, chemicals, and pharmaceuticals. Although exports slightly declined to $564.8 billion in 2023, the overall upward trend highlights Belgium's adaptability in navigating global economic challenges and maintaining strong intra-EU trade relationships.
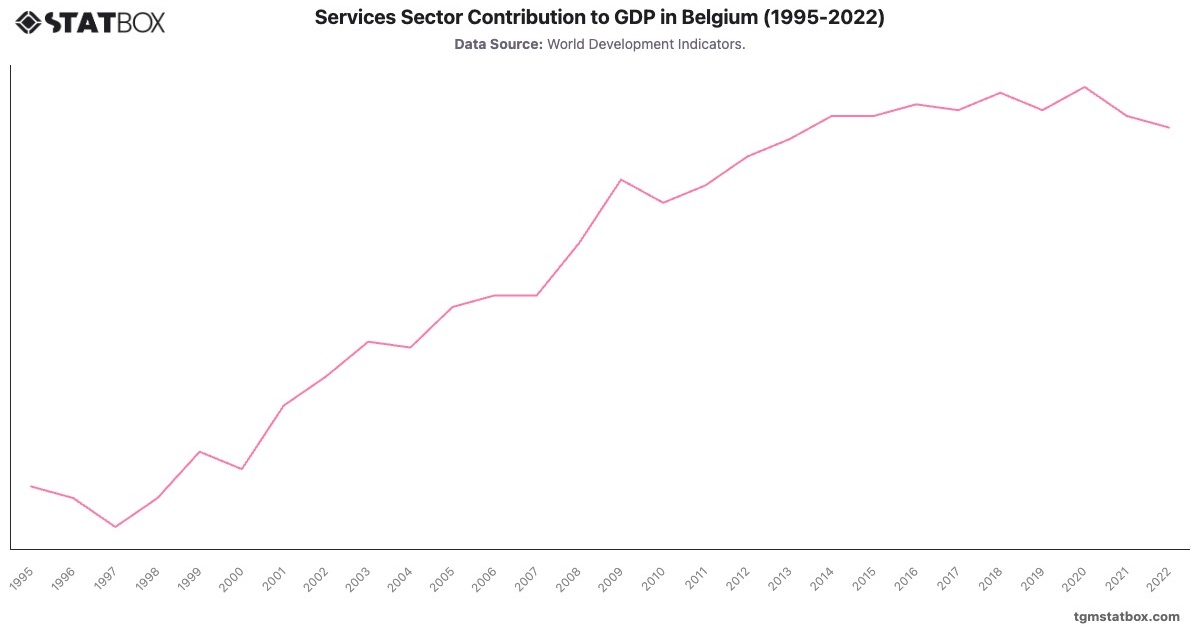
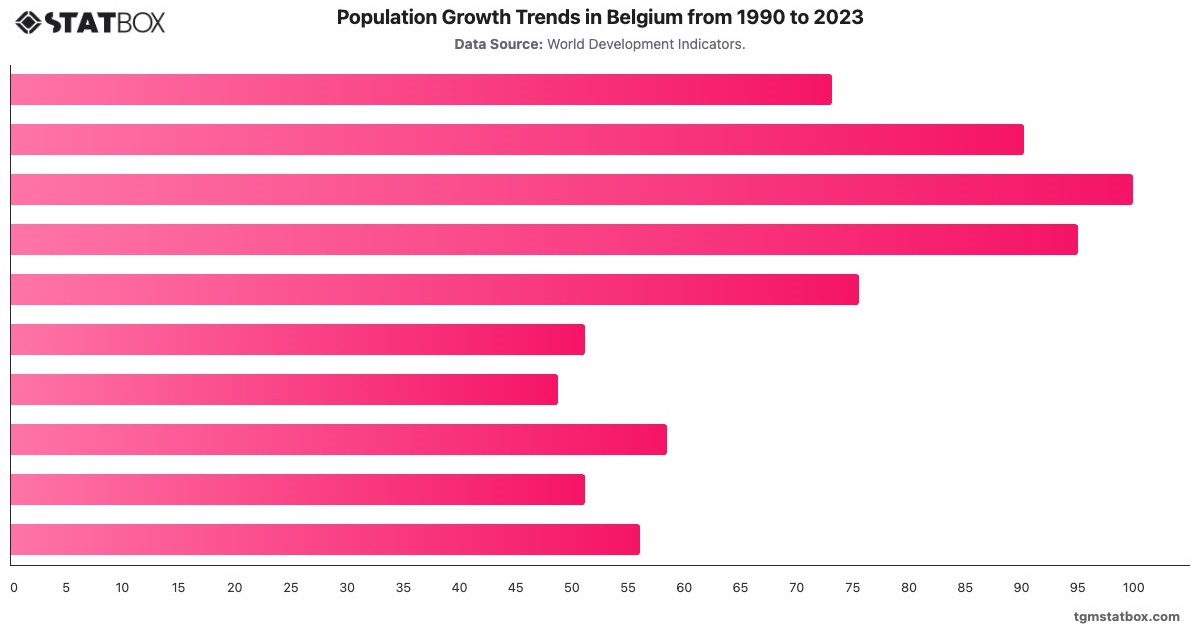
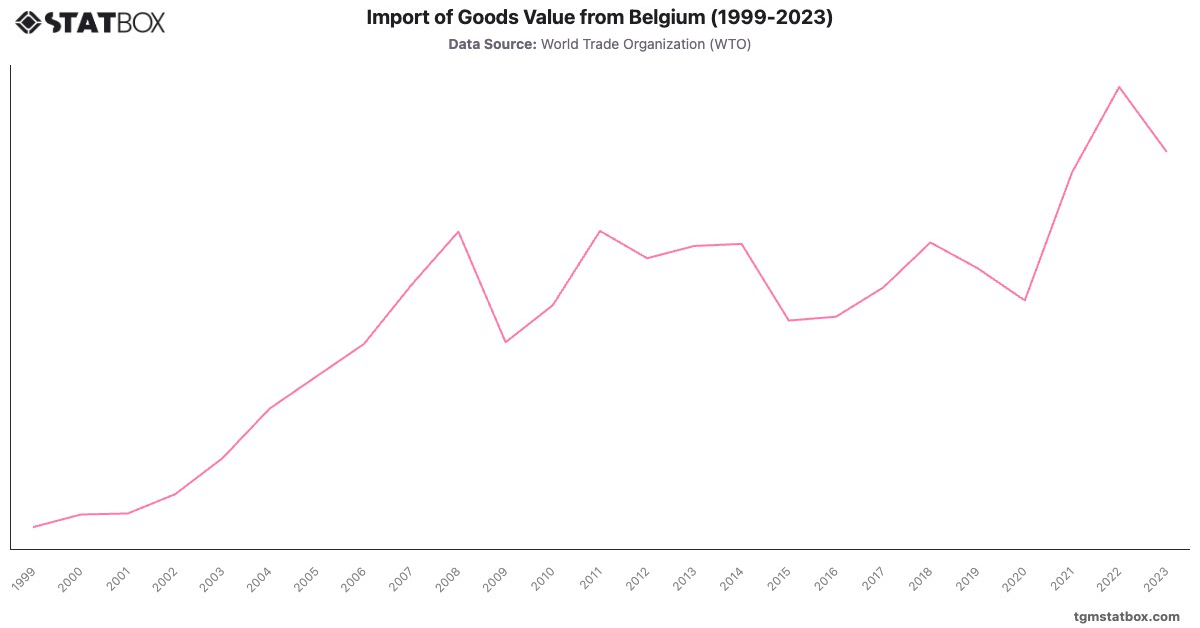
Gain a broader perspective by reviewing Belgium’s services sector share in GDP, Belgium’s imports value, Belgium’s population growth.