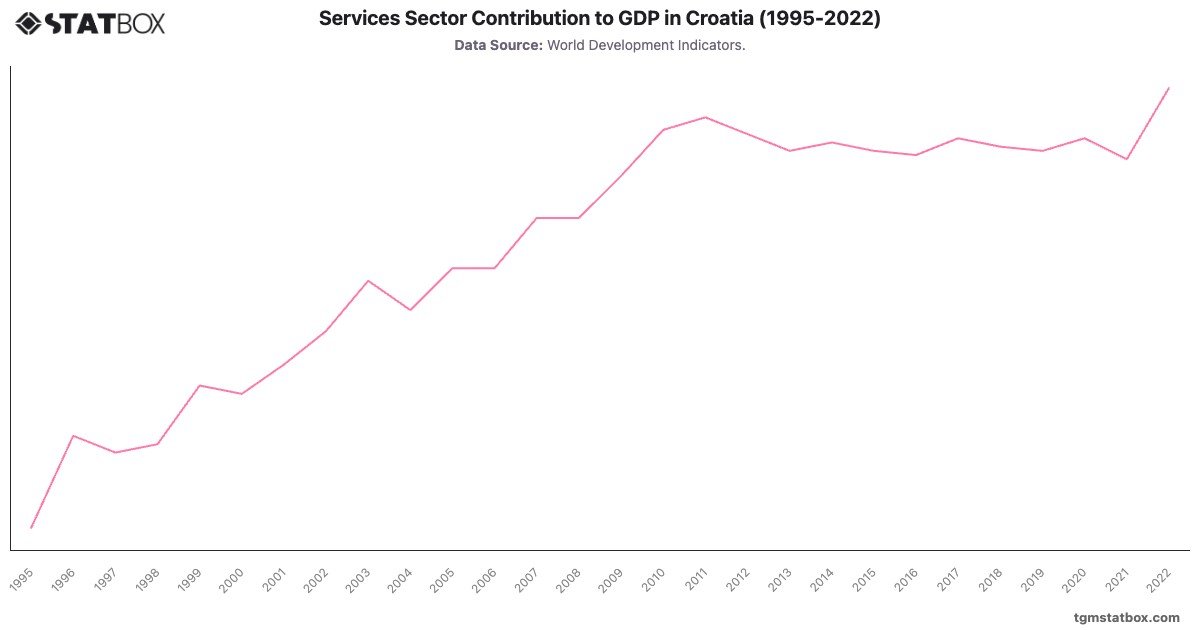
In Croatia, the services sector grew from in 1995 to in 2022, reflecting the country’s transition to a service-oriented economy following its independence. The 1990s saw gradual increases as tourism, trade, and financial services expanded, reaching by 2003. Economic stabilization and EU integration efforts in the 2000s supported further growth, with services peaking at in 2011. The share held steady around 59- from 2015 onward, with a slight increase in 2022. This growth underlines the sector’s vital role in Croatia's economy, driven by tourism, trade, and services essential to economic resilience and recovery efforts.
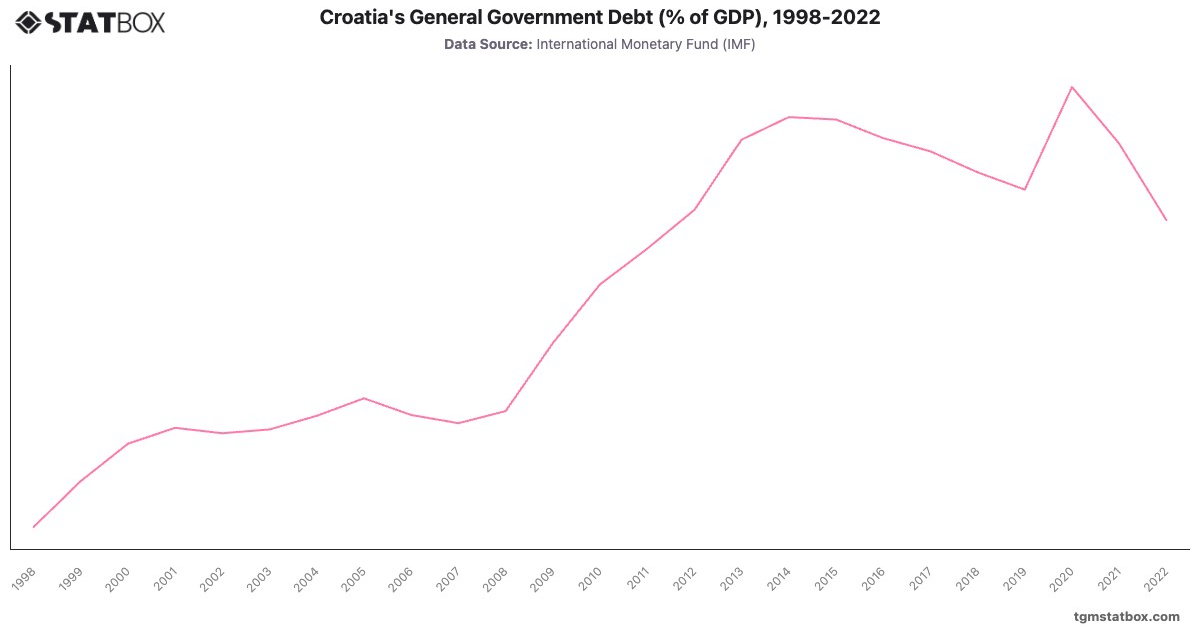
Find out more through related statistics on Croatia’s unemployment rate, Croatia’s agricultural contribution to GDP, Croatia’s public debt ratio.