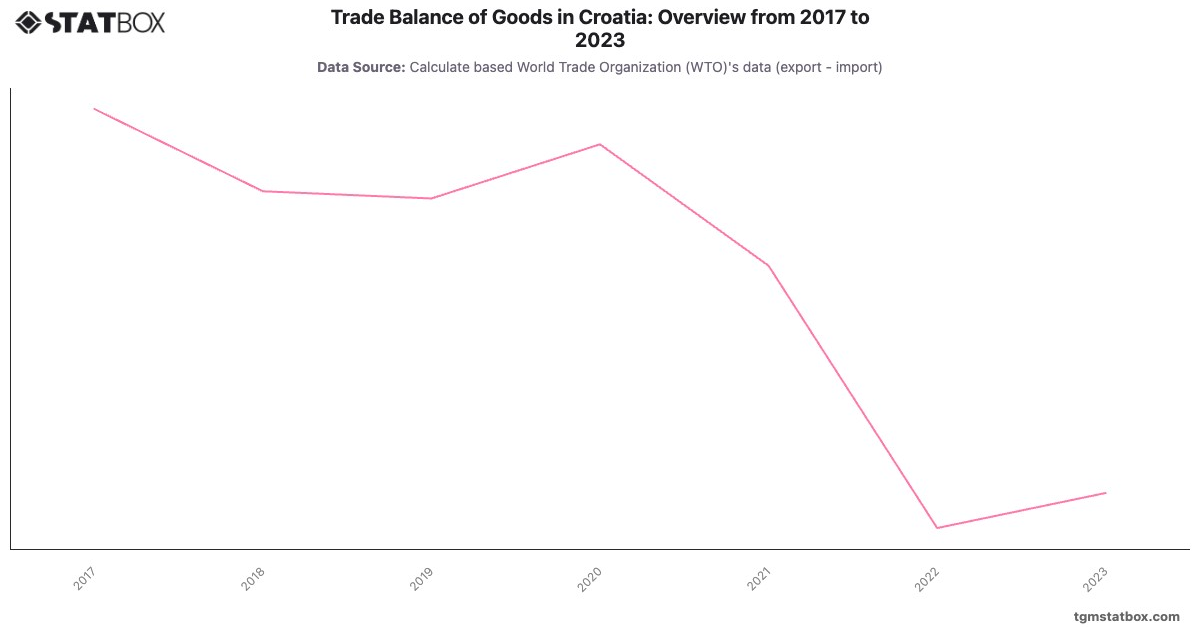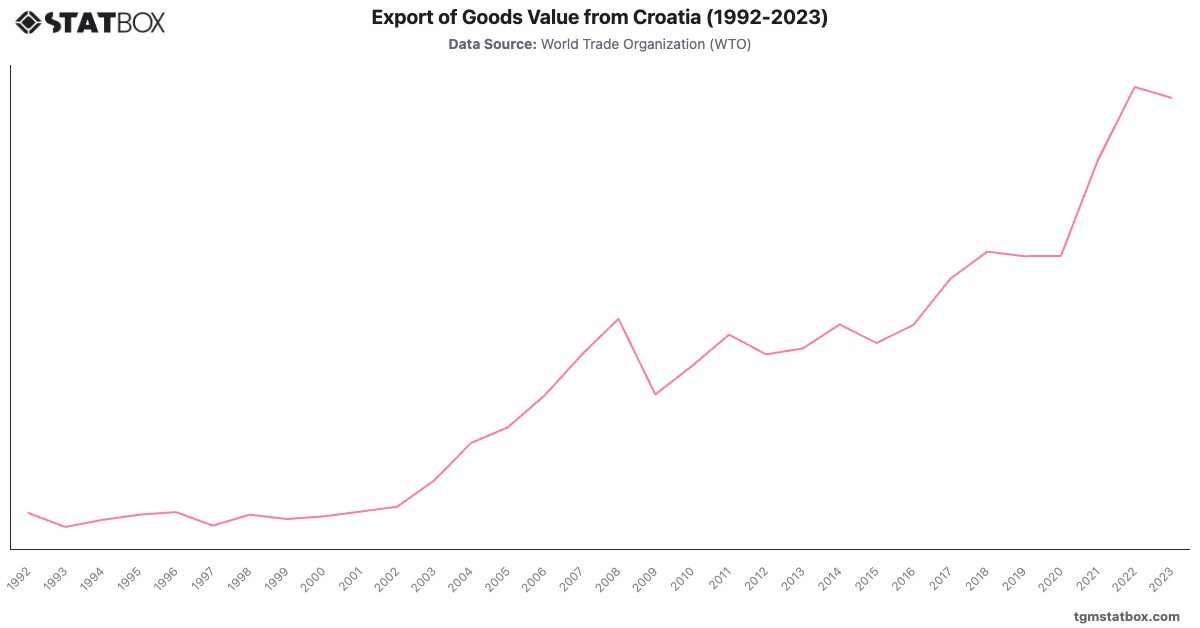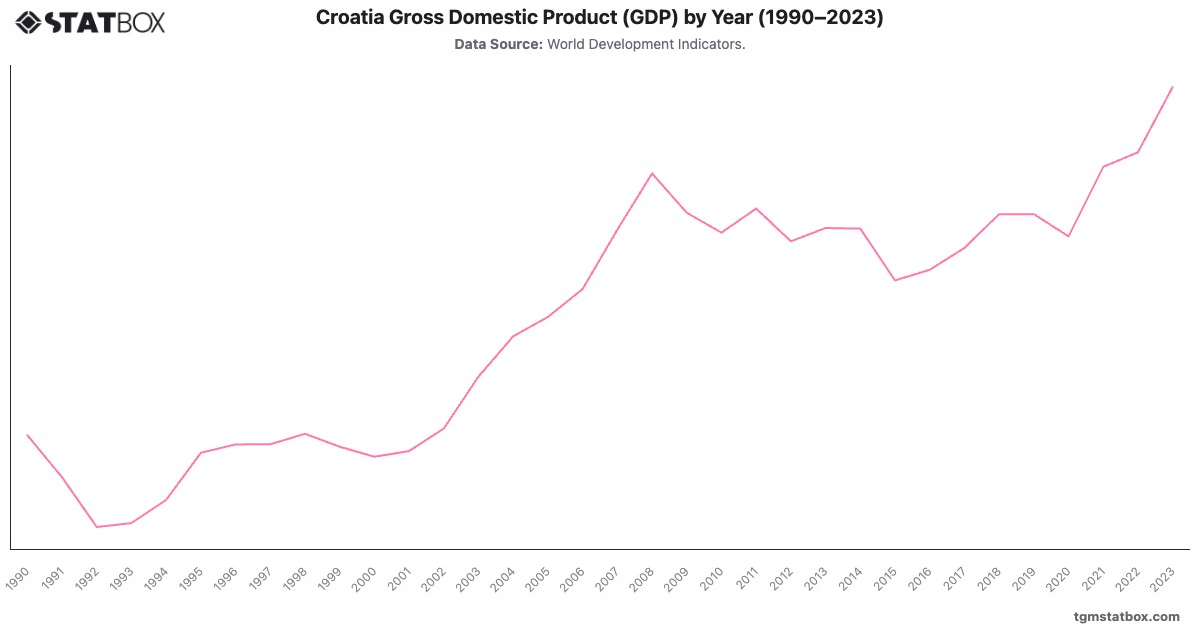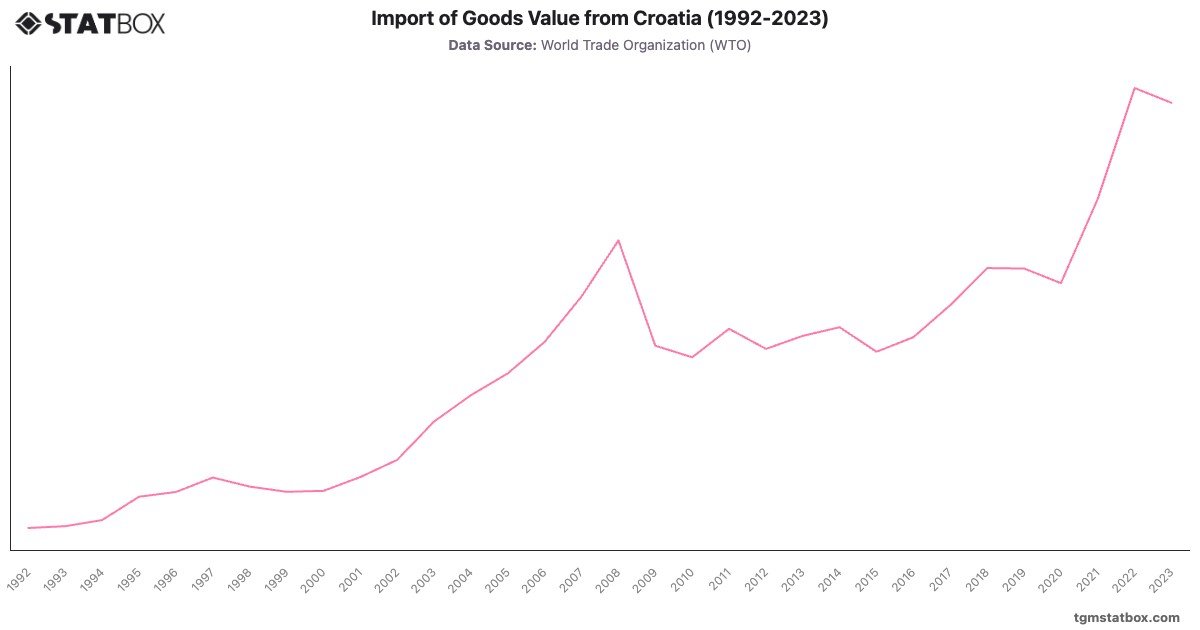
Croatia's import value grew from $4.5B in 1992 to $43.2B in 2023, reflecting the country's economic development and integration into the global market. Following the war of independence, imports rose steadily during the late 1990s and early 2000s, supported by reconstruction efforts and increasing trade liberalization. The entry into the EU in 2013 further boosted trade, with imports reaching $22B that year.
Significant growth occurred post-2020, as imports surged to $44.6B in 2022, driven by economic recovery from the COVID-19 pandemic and increased demand for consumer and industrial goods. A slight dip to $43.2B in 2023 suggests stabilization amid global economic pressures. Croatia’s import trends highlight its transition from recovery to growth, supported by EU membership and economic reforms.
Significant growth occurred post-2020, as imports surged to $44.6B in 2022, driven by economic recovery from the COVID-19 pandemic and increased demand for consumer and industrial goods. A slight dip to $43.2B in 2023 suggests stabilization amid global economic pressures. Croatia’s import trends highlight its transition from recovery to growth, supported by EU membership and economic reforms.
For additional information, visit statistics on Croatia’s industry sector share in GDP, Croatia’s unemployment rate, Croatia’s net lending/borrowing as percentage of GDP.