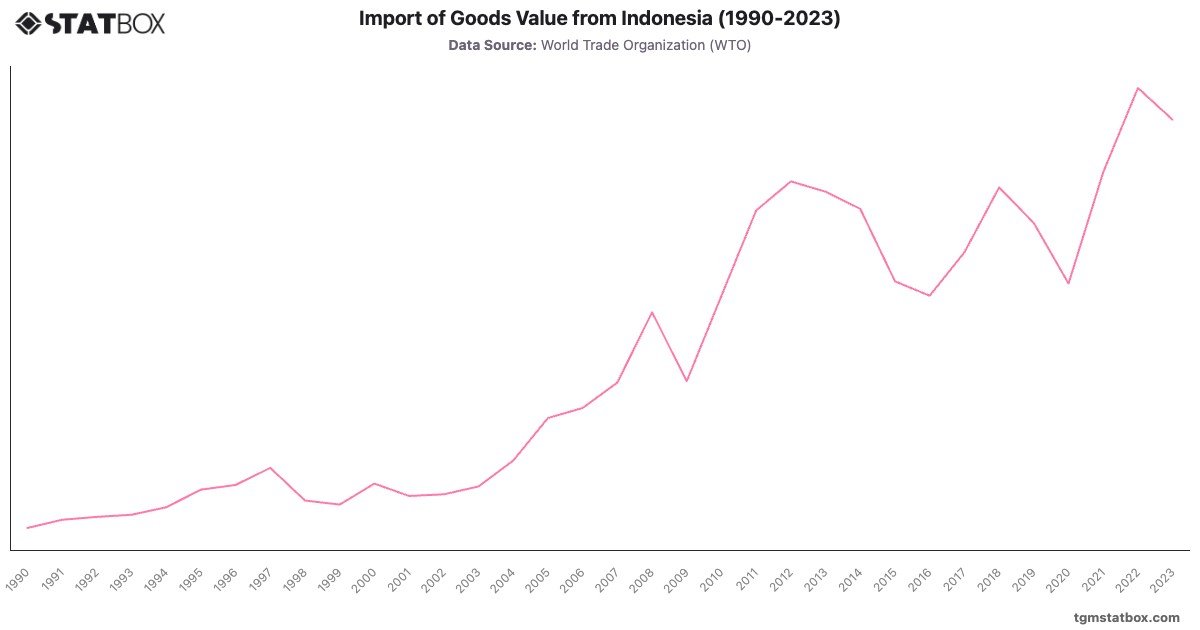
Indonesia’s import trends reflect its evolving economy, starting at $21.8B in 1990 and peaking at $237.4B in 2022. Key growth phases include a jump from $54.8B in 2004 to $127.5B in 2008, driven by rising commodity prices and infrastructure investments.
A decline during the 1998 Asian financial crisis and the 2009 global downturn highlights Indonesia’s vulnerability to external shocks. However, the post-2015 recovery, with imports reaching $237.4B in 2022, underscores renewed industrial growth and rising consumer demand. The $221.8B figure in 2023 reflects stabilization amid global economic challenges.
A decline during the 1998 Asian financial crisis and the 2009 global downturn highlights Indonesia’s vulnerability to external shocks. However, the post-2015 recovery, with imports reaching $237.4B in 2022, underscores renewed industrial growth and rising consumer demand. The $221.8B figure in 2023 reflects stabilization amid global economic challenges.
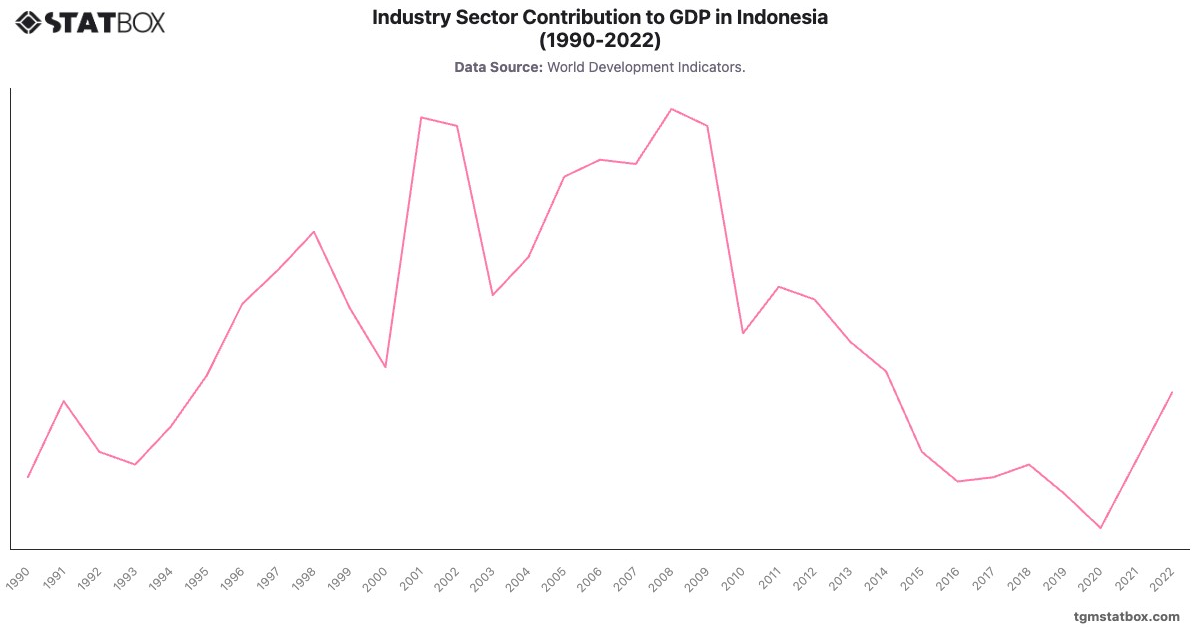
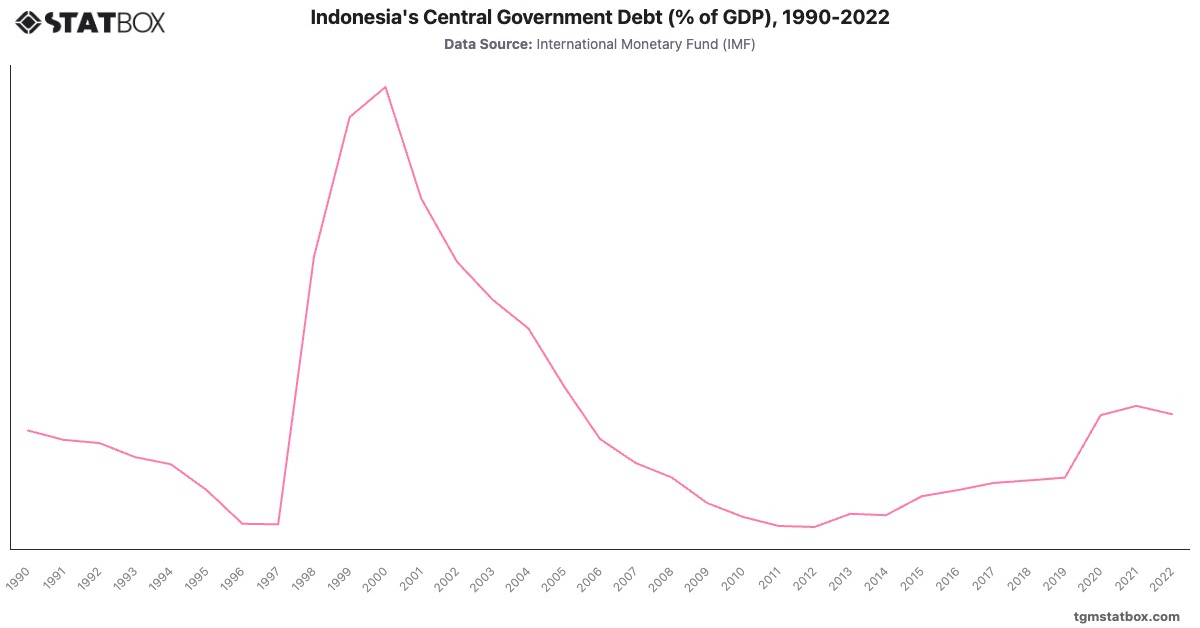
Find out more through related statistics on Indonesia’s services sector share in GDP, Industry sector’s GDP share in Indonesia, Indonesia’s government debt-to-GDP ratio.