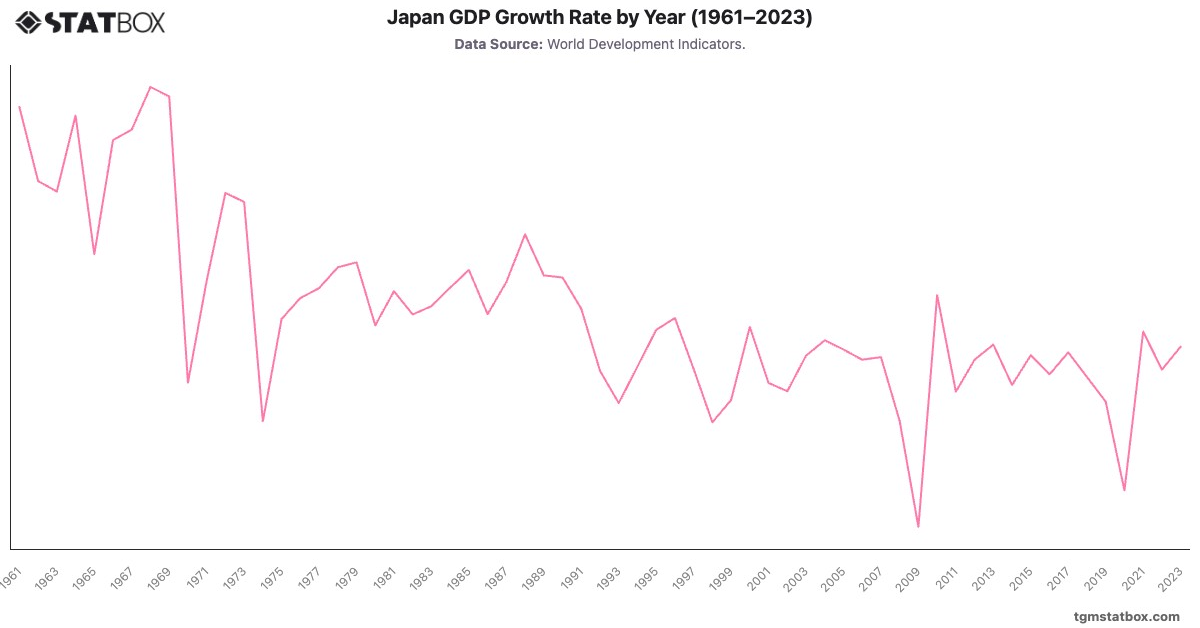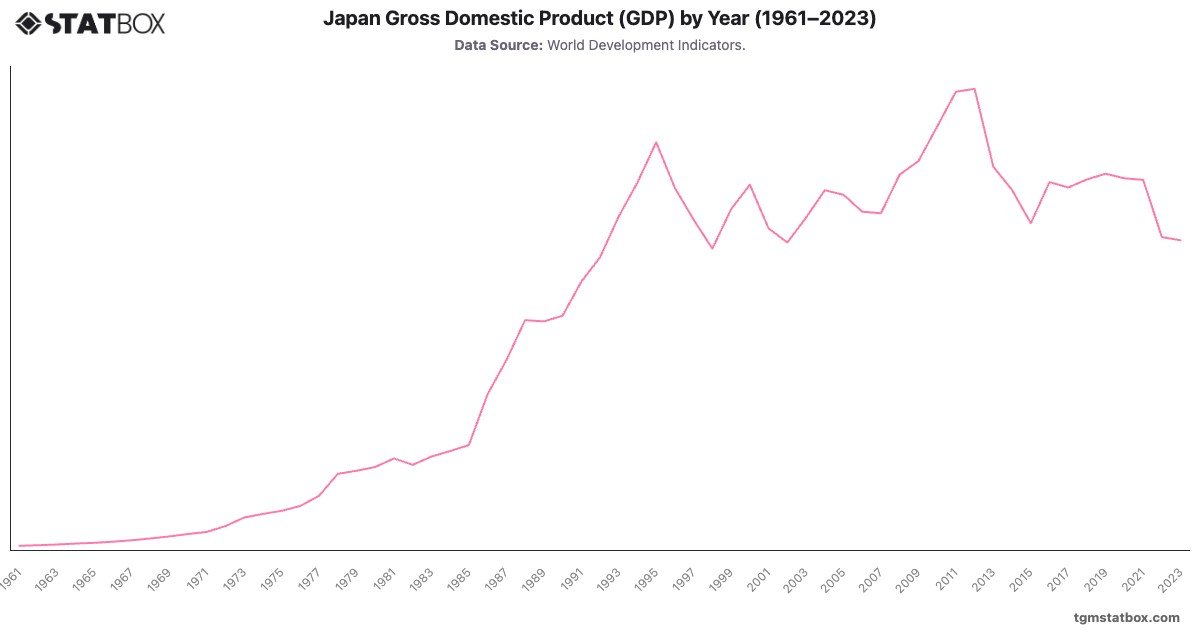
Japan’s GDP highlights its post-war recovery and status as an economic powerhouse. From $57.2 billion in 1961, GDP soared during the 1970s, reaching $490 billion in 1974, fueled by industrial exports and technological advancements. The 1980s marked the peak of Japan's economic dominance, with GDP growing to $5.54 trillion by 1995.
However, the bursting of the asset bubble in the early 1990s initiated a "lost decade," causing stagnation. Recent years have seen moderate growth, though GDP contracted to $4.21 trillion in 2023 due to demographic challenges and global uncertainties. Japan's resilience lies in its high-tech industries and innovation-driven sectors.
However, the bursting of the asset bubble in the early 1990s initiated a "lost decade," causing stagnation. Recent years have seen moderate growth, though GDP contracted to $4.21 trillion in 2023 due to demographic challenges and global uncertainties. Japan's resilience lies in its high-tech industries and innovation-driven sectors.
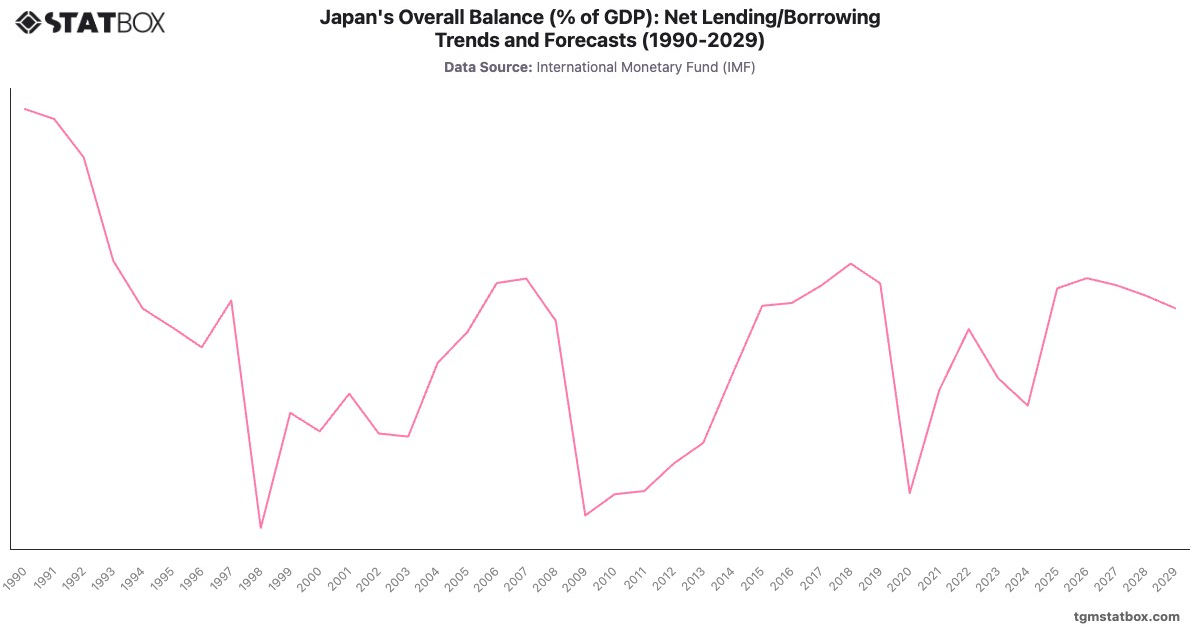
Explore related charts to gain a better understanding of Japan’s annual GDP growth rate, Japan’s urbanization trend, Japan’s net lending/borrowing as a percentage of GDP.