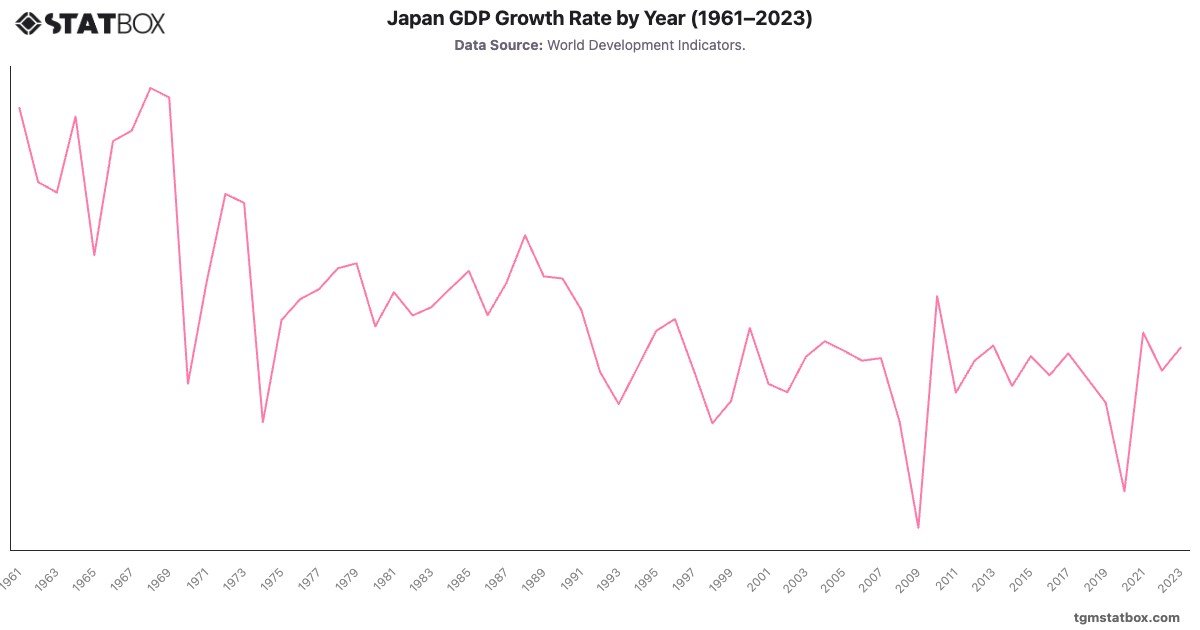
Japan GDP Growth (1961-2023)
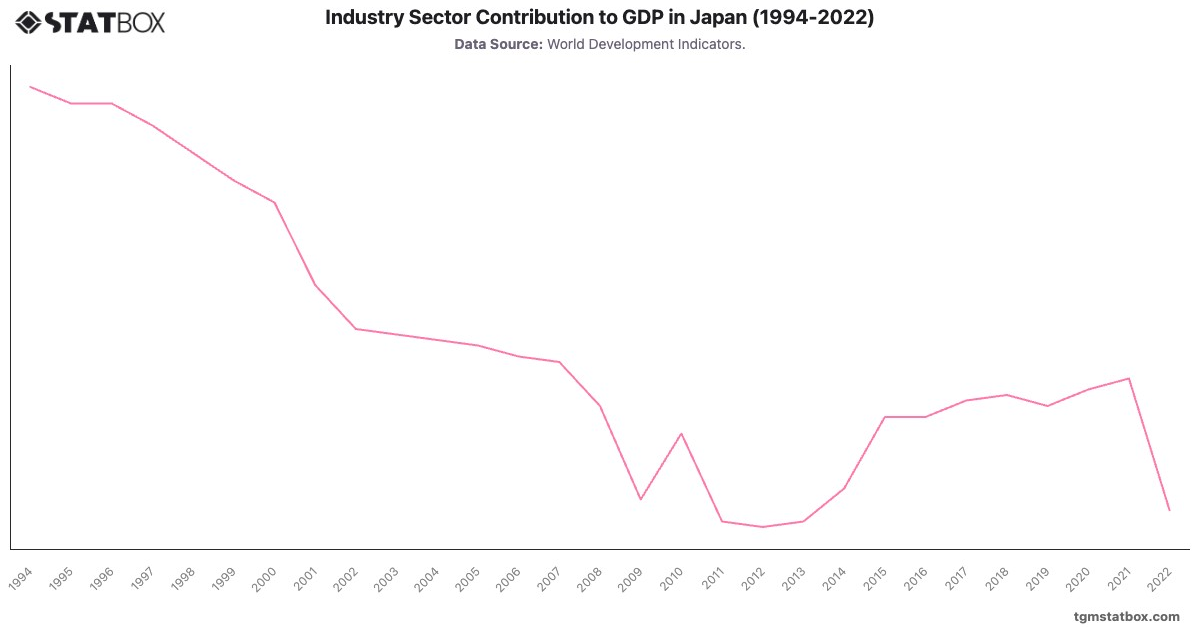
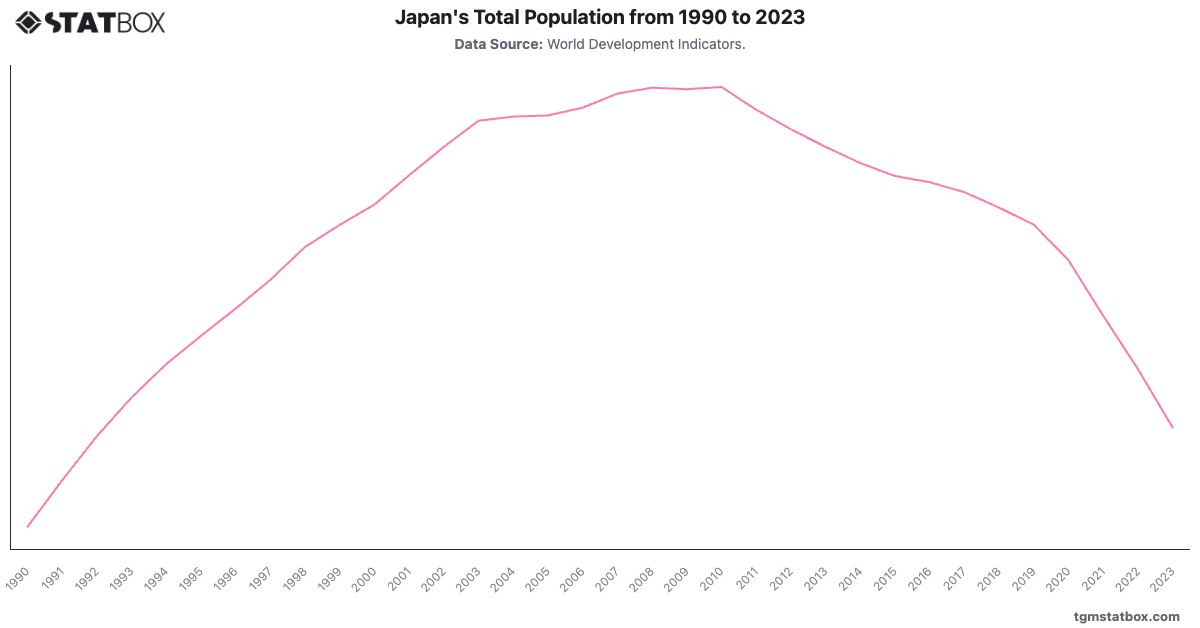
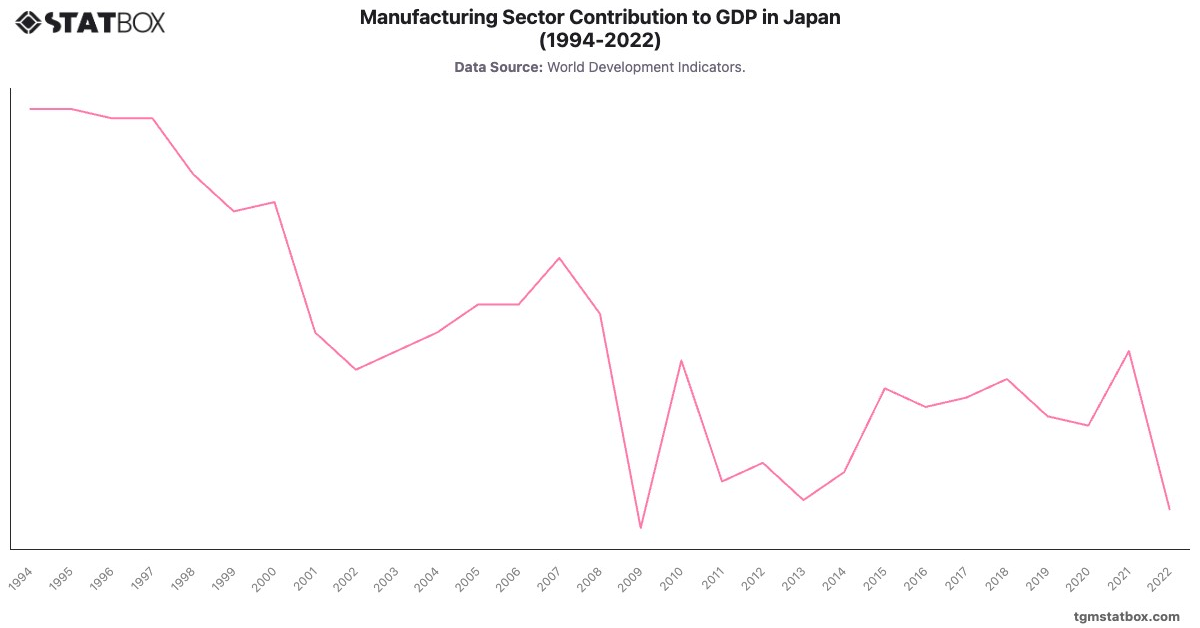
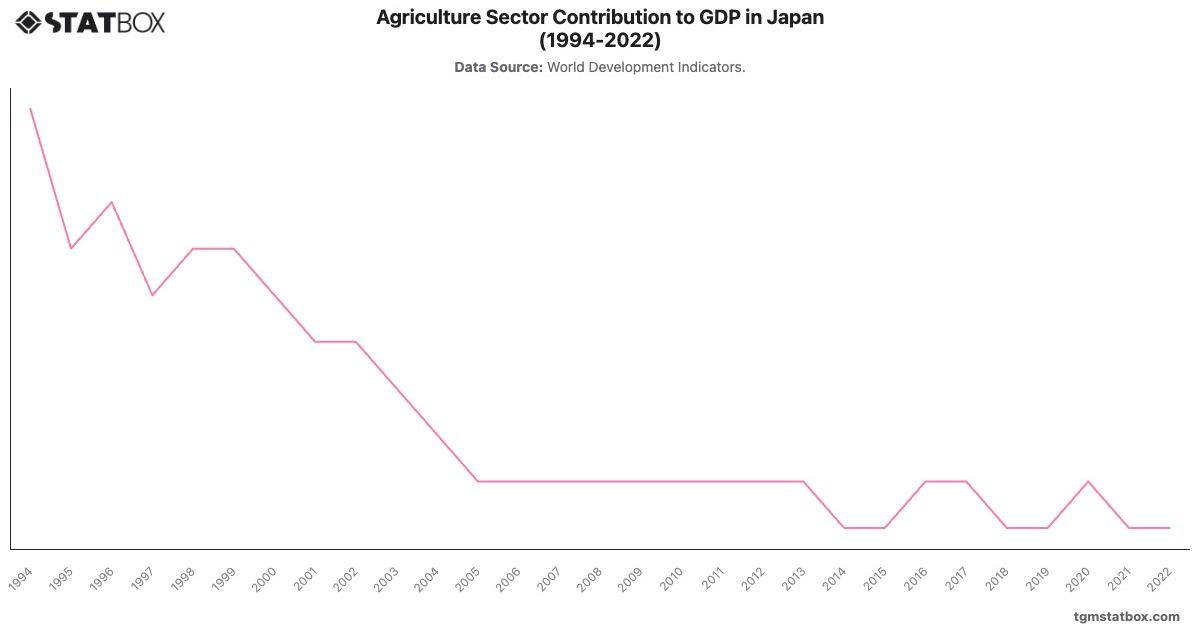
Japan experienced rapid post-war growth from the 1960s to the early 1970s, peaking at in 1968 as the economy industrialized rapidly. However, the 1990s saw prolonged stagnation, with near-zero growth in some years due to asset bubble collapse and an aging population. The 2008 financial crisis and 2011 earthquake further dampened growth, though recovery efforts saw a modest rebound. In 2021, GDP growth reached , though by 2023, growth remained low at , with structural economic challenges.
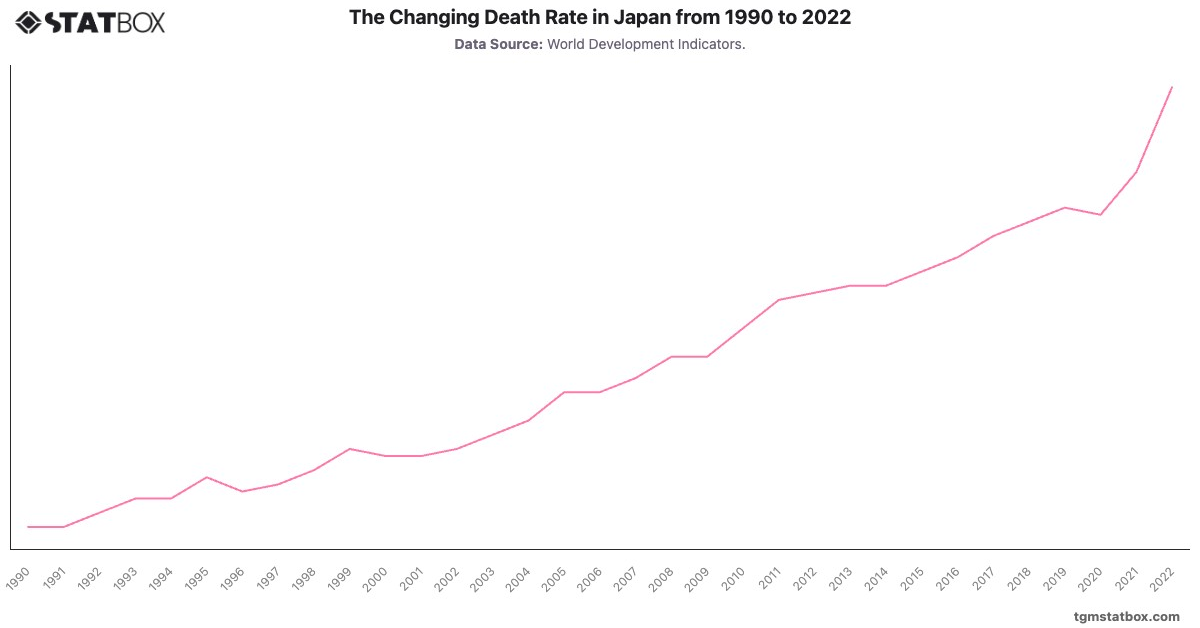
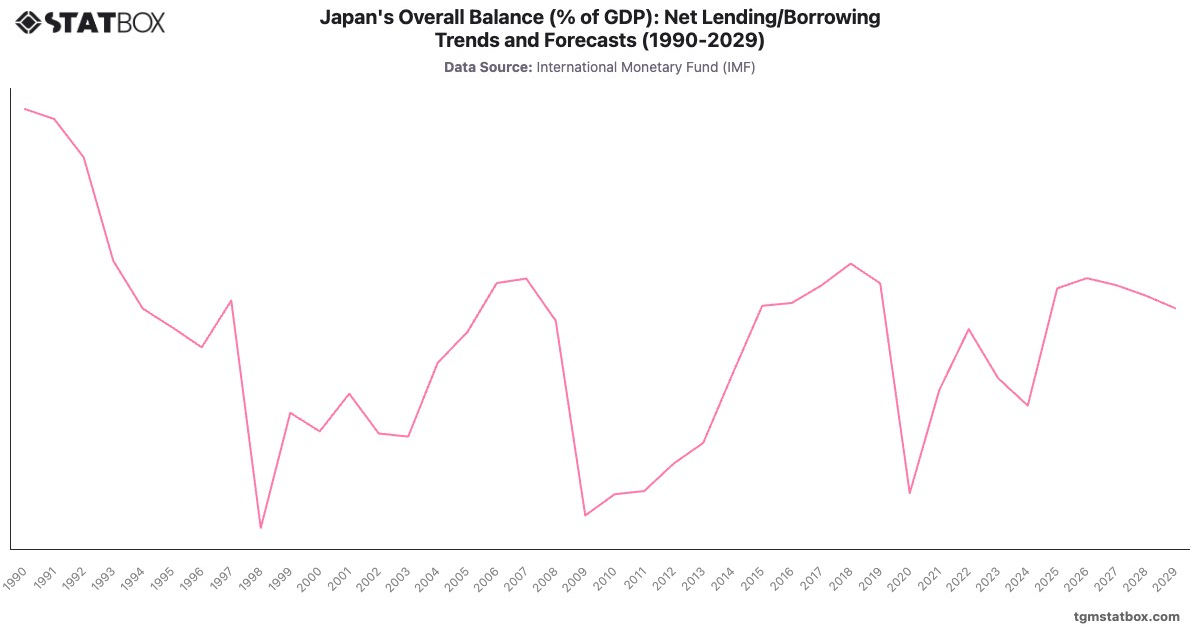
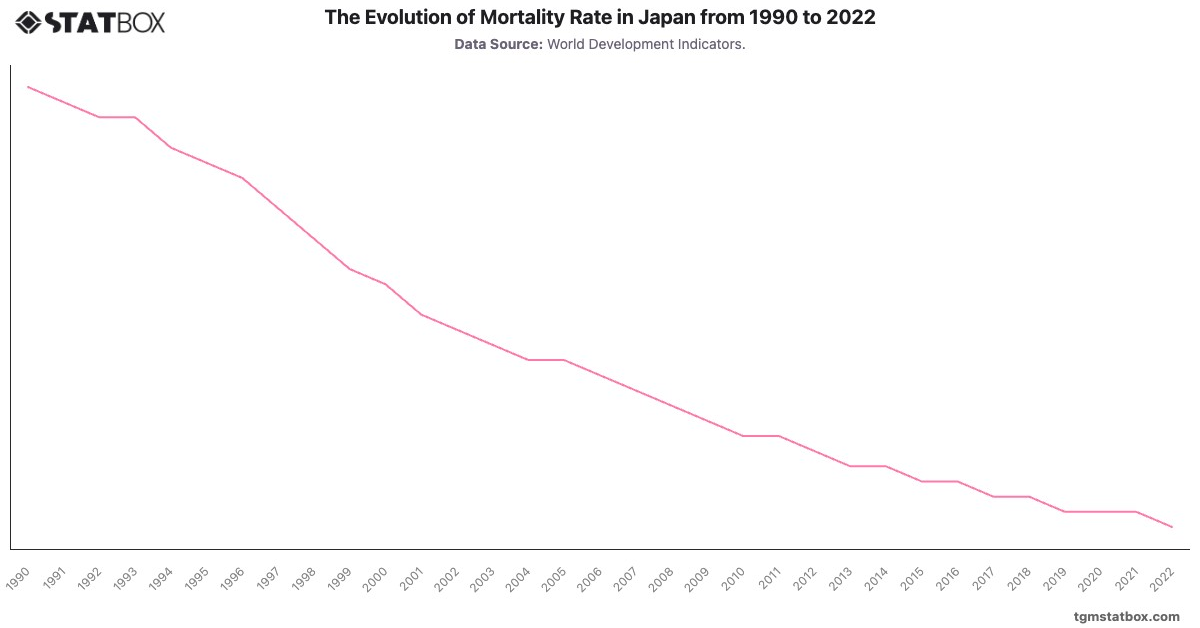
Find out more through related statistics on Japan’s net lending/borrowing as a percentage of GDP, Japan’s mortality rate, Japan’s working-age population share.