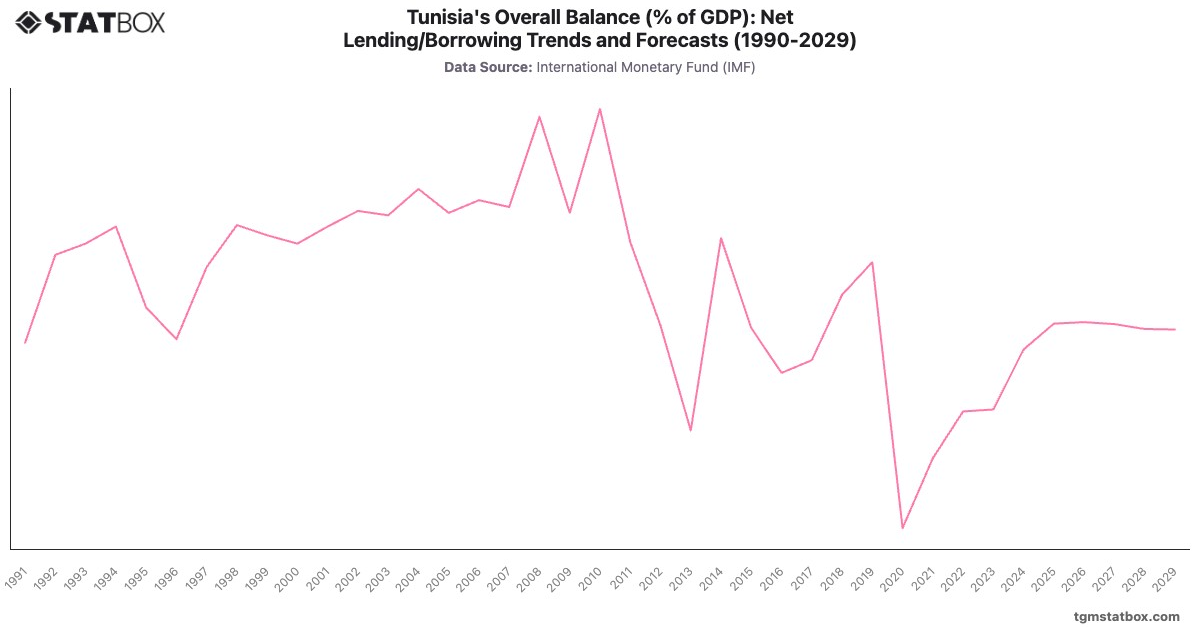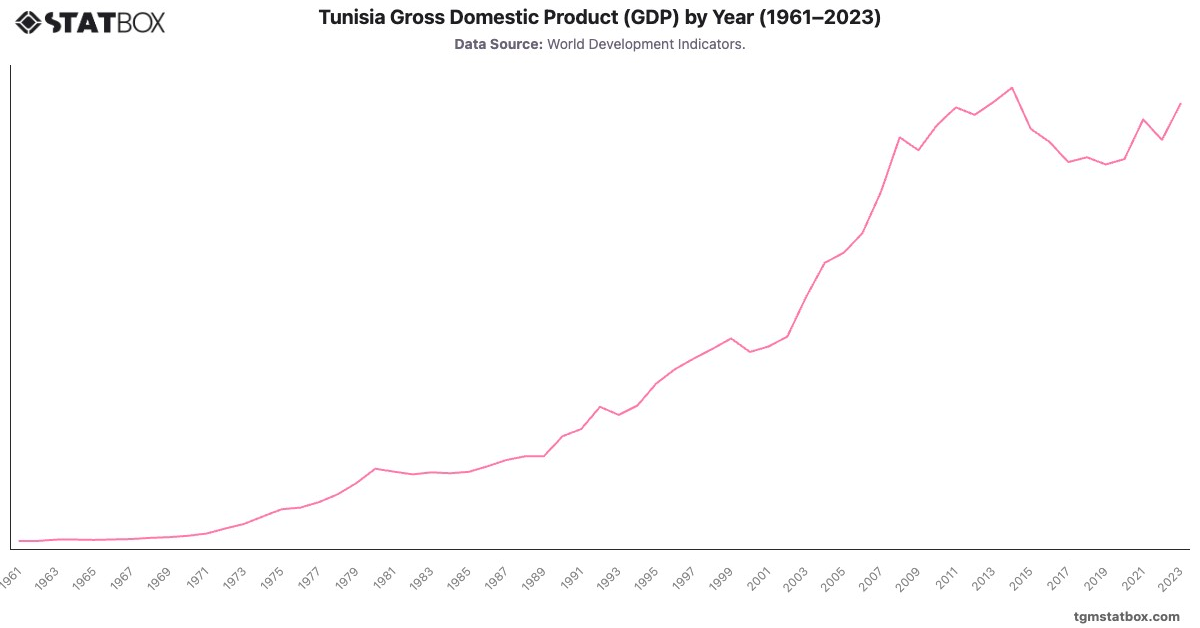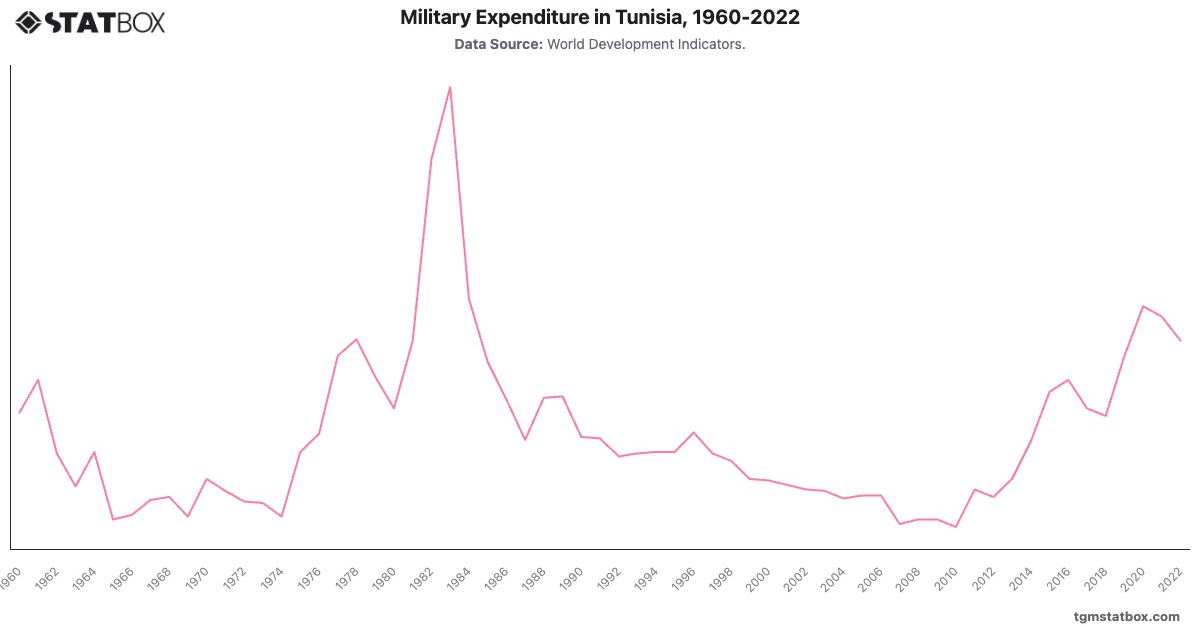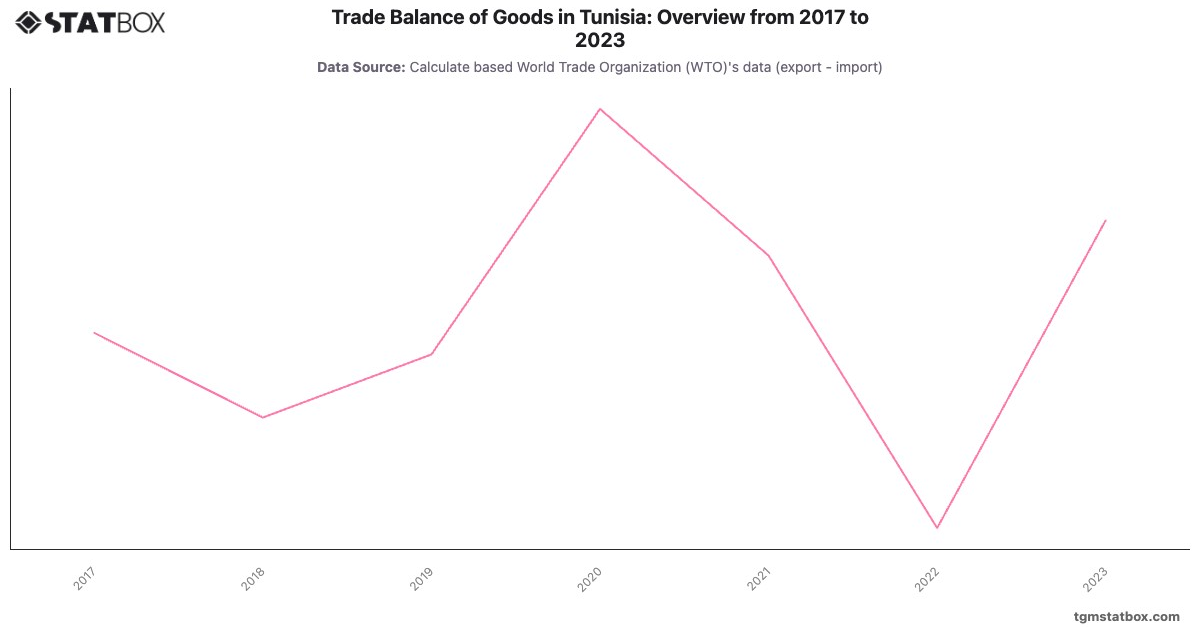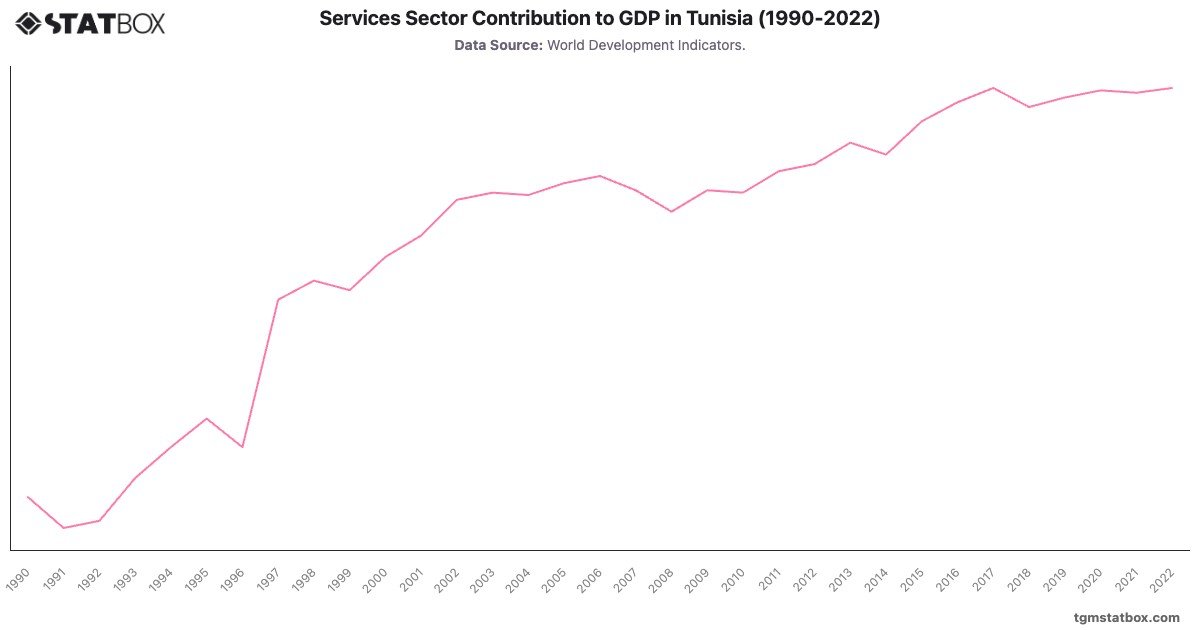
Tunisia's services sector has grown significantly, from in 1990 to a steady by 2022. Key factors driving this growth include the expansion of tourism, trade, and finance, especially post-2000 as Tunisia attracted foreign investment. Despite challenges during the 2011 revolution, the sector remained resilient, and growth resumed as stability returned. A steady increase post-2015 reflects Tunisia’s investment in digital services and tourism revival. Services remained vital in 2022, contributing over as the economy focuses on diversifying away from agriculture and manufacturing.
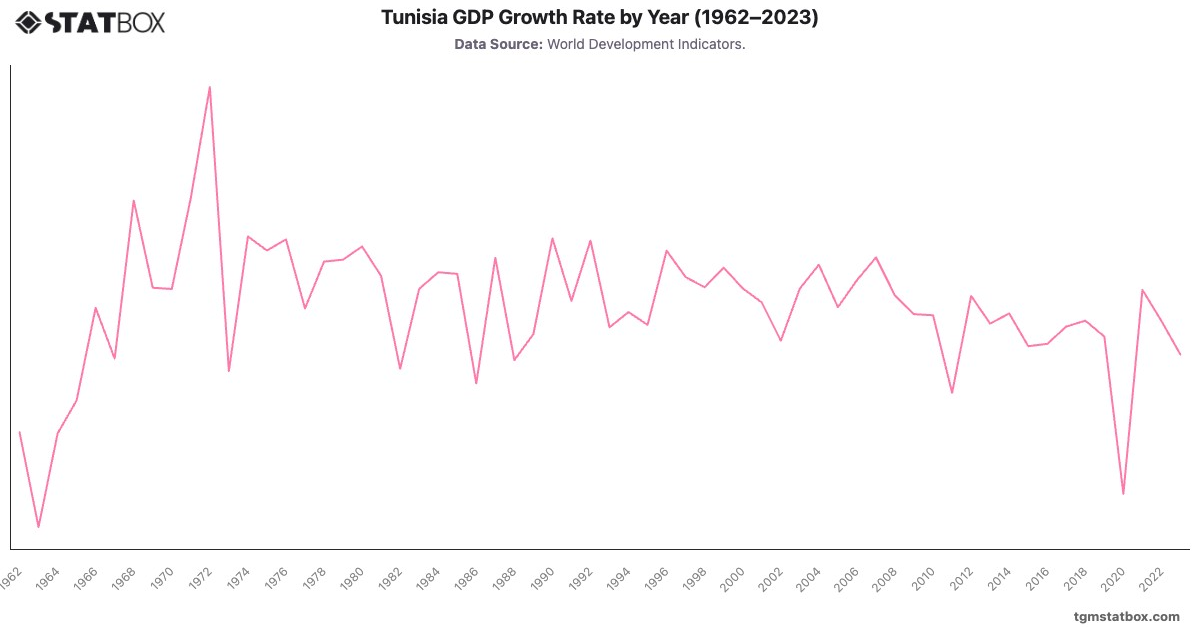
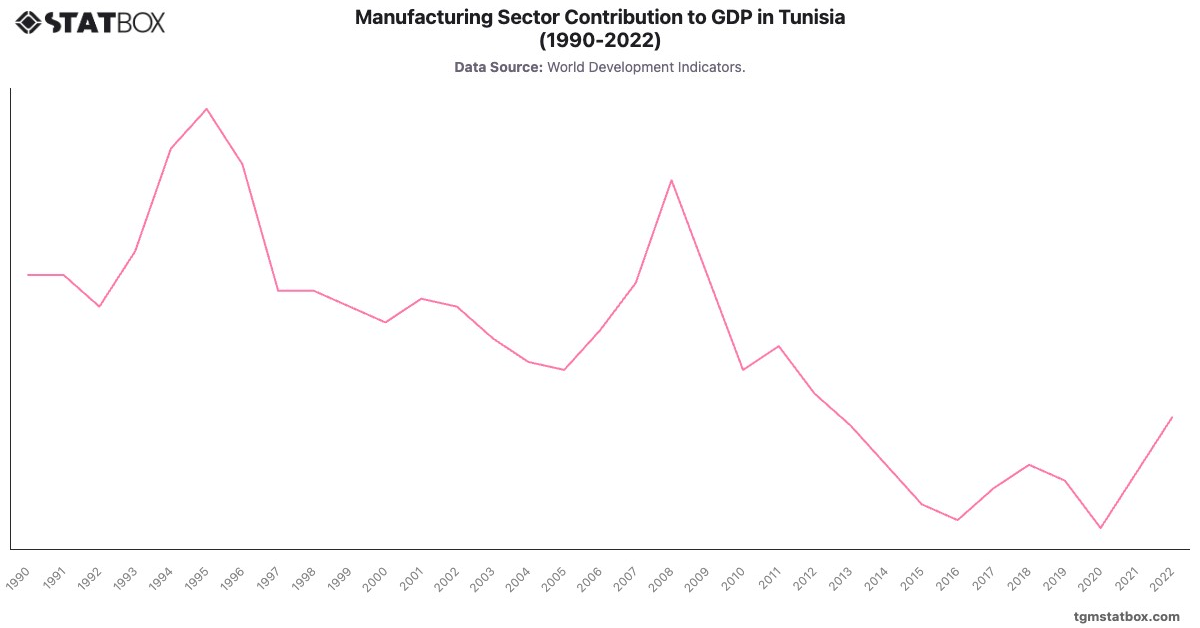
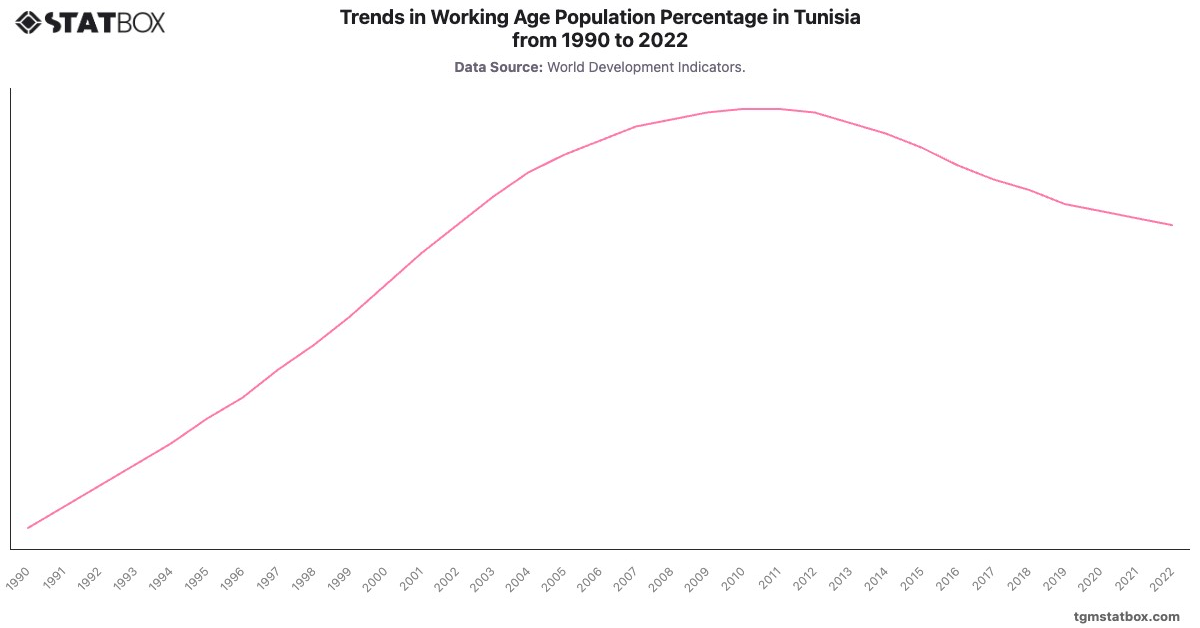
Gain a broader perspective by reviewing Tunisia’s annual GDP growth rate, Tunisia’s manufacturing sector share in GDP, Tunisia’s working-age population share.