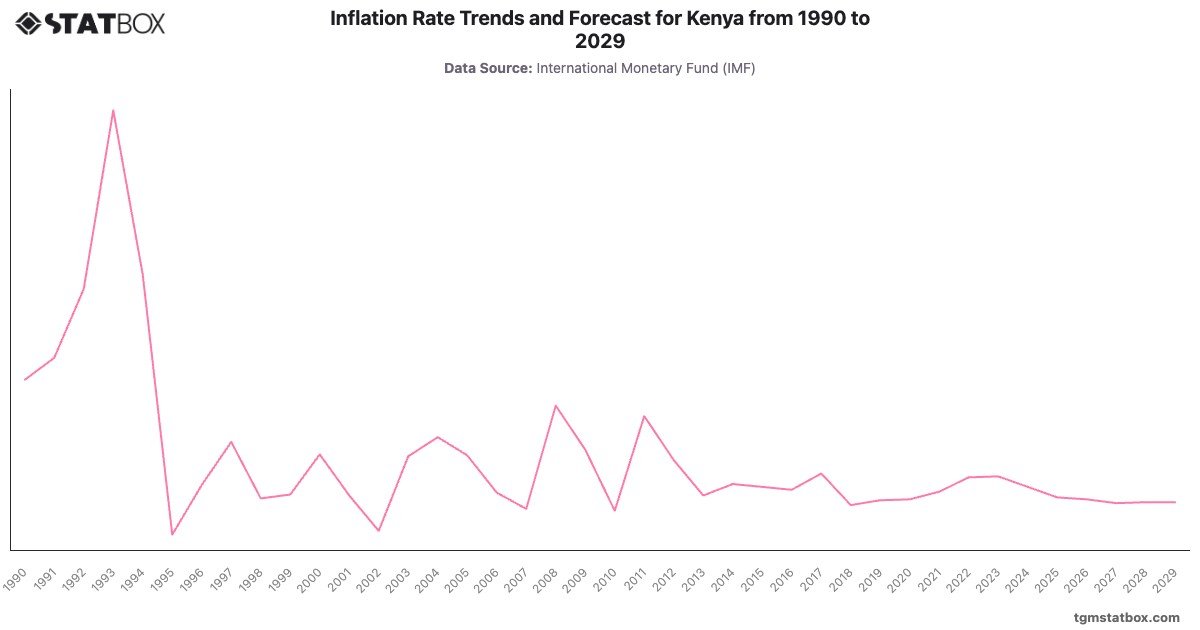
Kenya experienced severe inflation in the early 1990s, with rates peaking at in 1993 due to political instability and economic mismanagement. Inflation moderated to single digits by the late 1990s, but spikes occurred in 2008 () and 2011 () due to drought and rising food prices.
In 2023, inflation stood at , reflecting global economic pressures. Forecasts predict a decline to by 2028, signaling improved economic stability and effective policy interventions.
In 2023, inflation stood at , reflecting global economic pressures. Forecasts predict a decline to by 2028, signaling improved economic stability and effective policy interventions.
For a deeper dive into the topic, explore Kenya’s central government debt to GDP ratio, Kenya’s agricultural share in GDP, Kenya’s population figures.