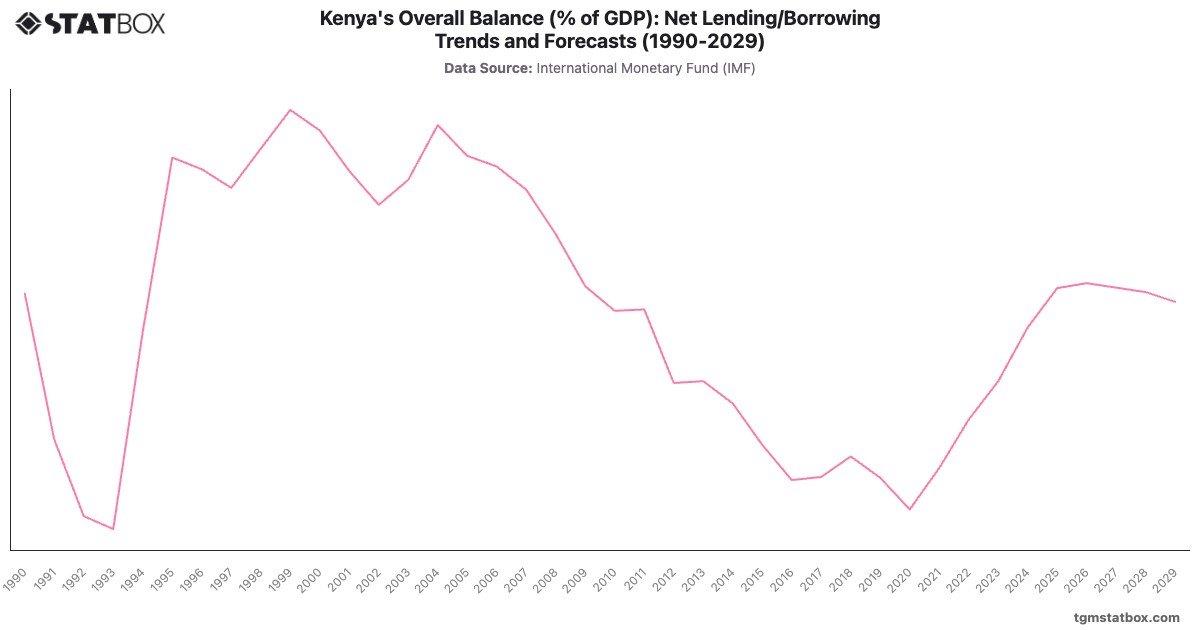
Kenya’s fiscal history underscores the struggles of managing deficits amid developmental needs. The 1990s were marked by high deficits, peaking at - in 1993, driven by political instability and economic mismanagement. Efforts to stabilize the economy brought temporary improvements, with near-balanced budgets by 2000.
The pandemic caused deficits to rise to - in 2020, but recovery efforts have seen gradual improvement. Projections indicate deficits narrowing to - by 2029, reflecting fiscal consolidation efforts and increased revenue mobilization.
The pandemic caused deficits to rise to - in 2020, but recovery efforts have seen gradual improvement. Projections indicate deficits narrowing to - by 2029, reflecting fiscal consolidation efforts and increased revenue mobilization.
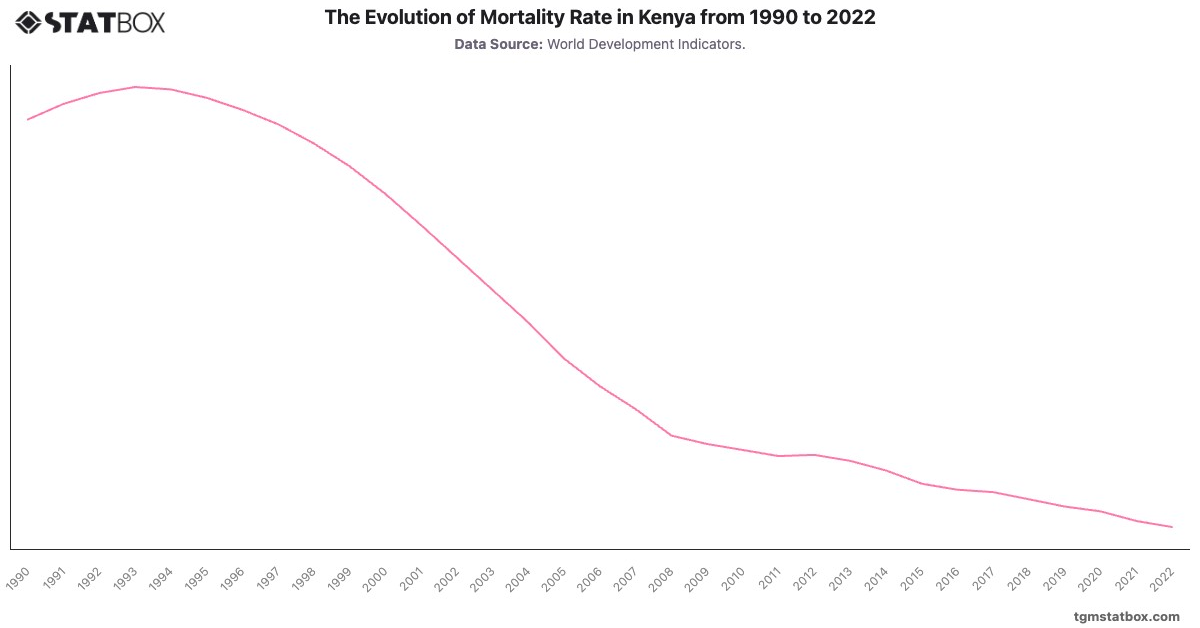
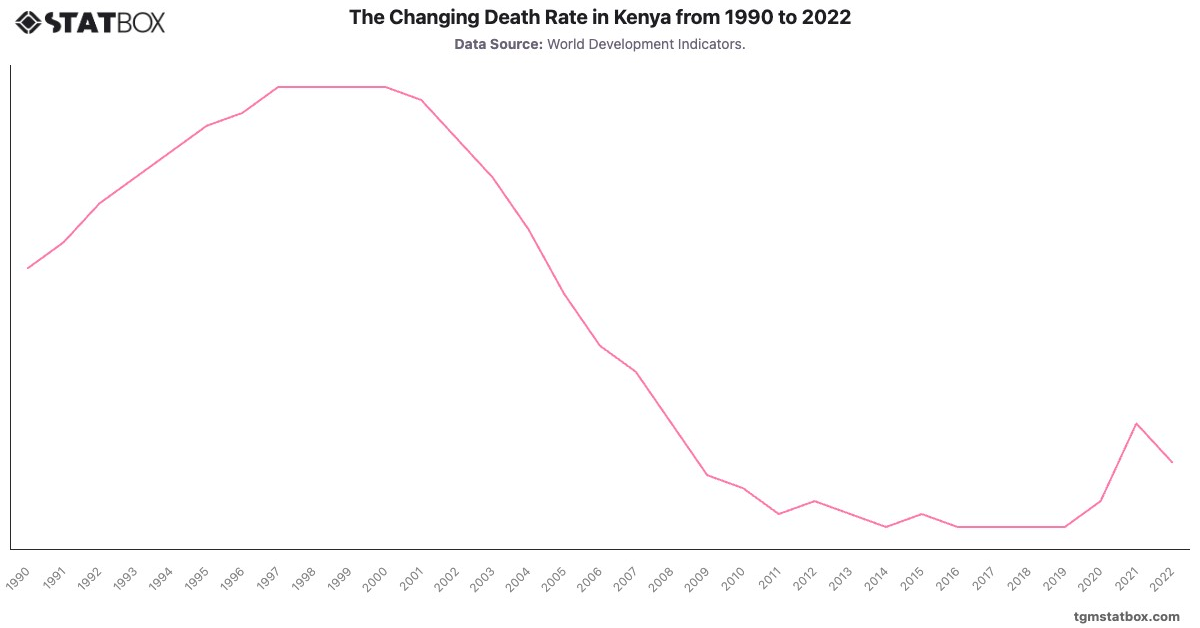
For additional information, visit statistics on Kenya’s agricultural share in GDP, Industry sector’s share in Kenya’s GDP, Kenya’s mortality rate changes.