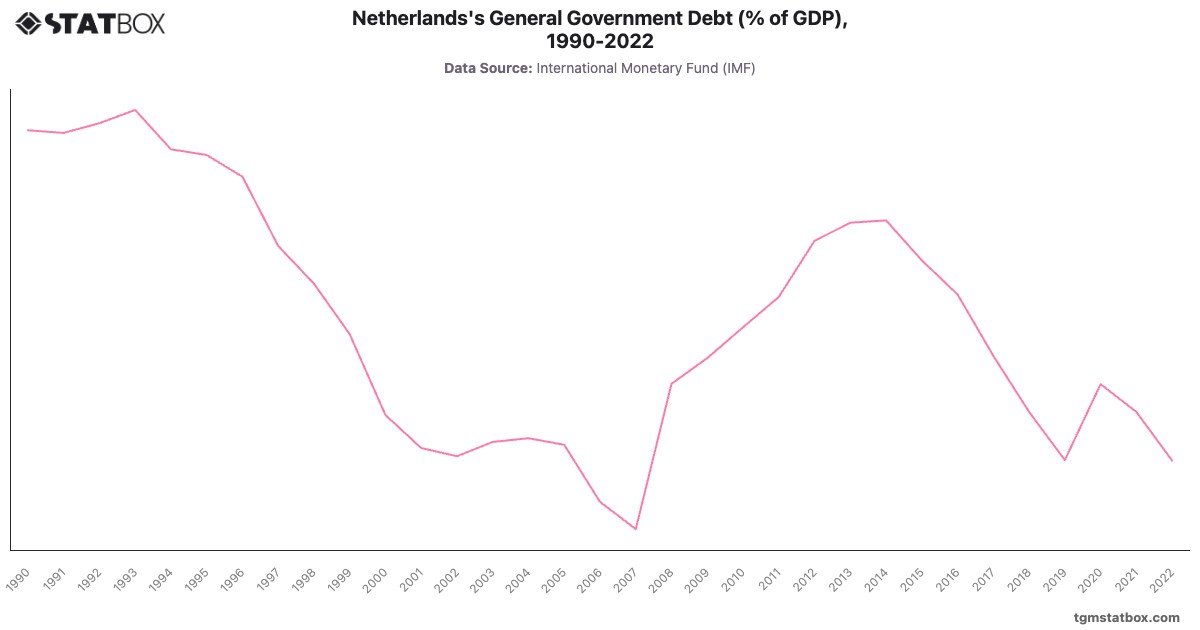
The Netherlands saw fluctuations in its debt-to-GDP ratio from 1990 to 2022, primarily influenced by economic cycles, fiscal policies, and external crises. In the early 1990s, government debt remained relatively high, peaking at in 1993 due to a slower economic growth phase. The Netherlands implemented fiscal reforms, leading to a reduction in debt over the following years, dropping to in 1999. By 2001, debt levels decreased further, reaching , a result of prudent fiscal policies and a growing economy.
However, the 2008 financial crisis significantly impacted the debt ratio, with levels rising to in 2011 as the government increased spending to support economic stability. Debt peaked again during the European debt crisis in 2013 at , but fiscal consolidation efforts brought it down gradually. By 2019, the Netherlands had reduced its debt to . The COVID-19 pandemic temporarily reversed this trend, raising the debt ratio to in 2020 due to increased public spending on health and economic support. Recovery efforts in the following years saw the debt level return to pre-pandemic figures, ending at in 2022.
However, the 2008 financial crisis significantly impacted the debt ratio, with levels rising to in 2011 as the government increased spending to support economic stability. Debt peaked again during the European debt crisis in 2013 at , but fiscal consolidation efforts brought it down gradually. By 2019, the Netherlands had reduced its debt to . The COVID-19 pandemic temporarily reversed this trend, raising the debt ratio to in 2020 due to increased public spending on health and economic support. Recovery efforts in the following years saw the debt level return to pre-pandemic figures, ending at in 2022.
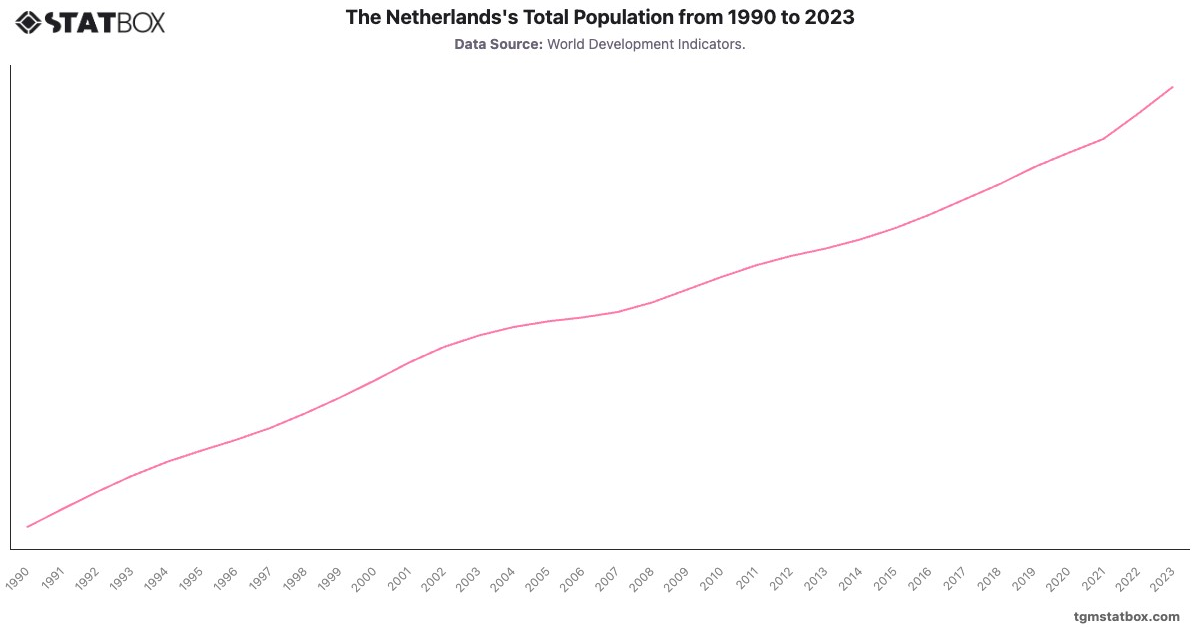
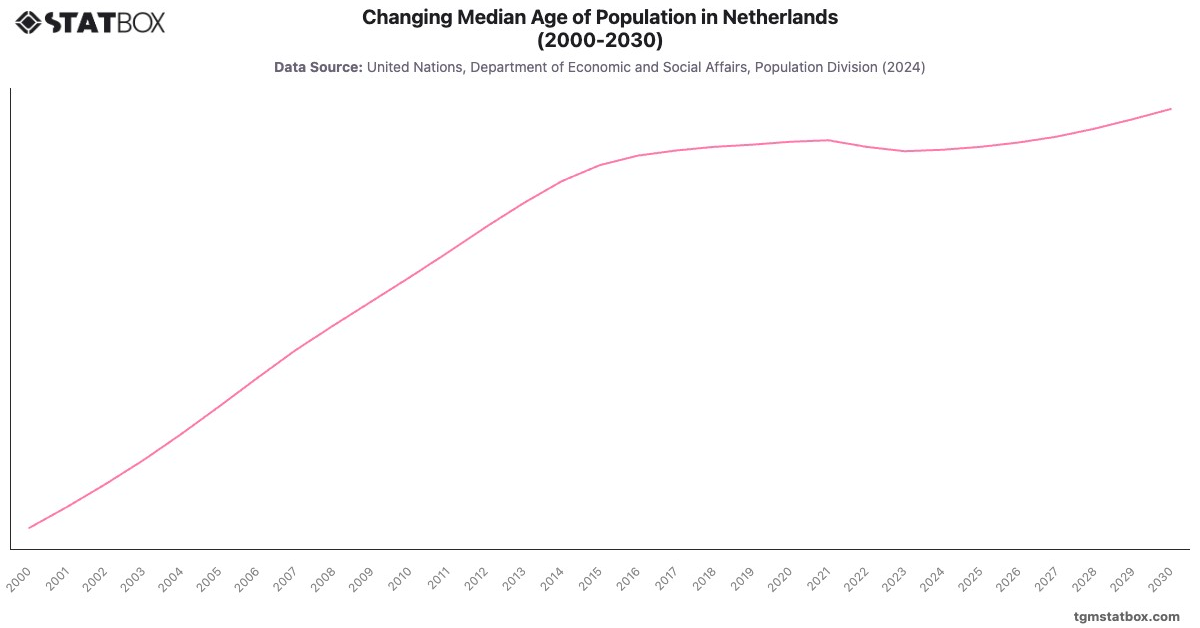
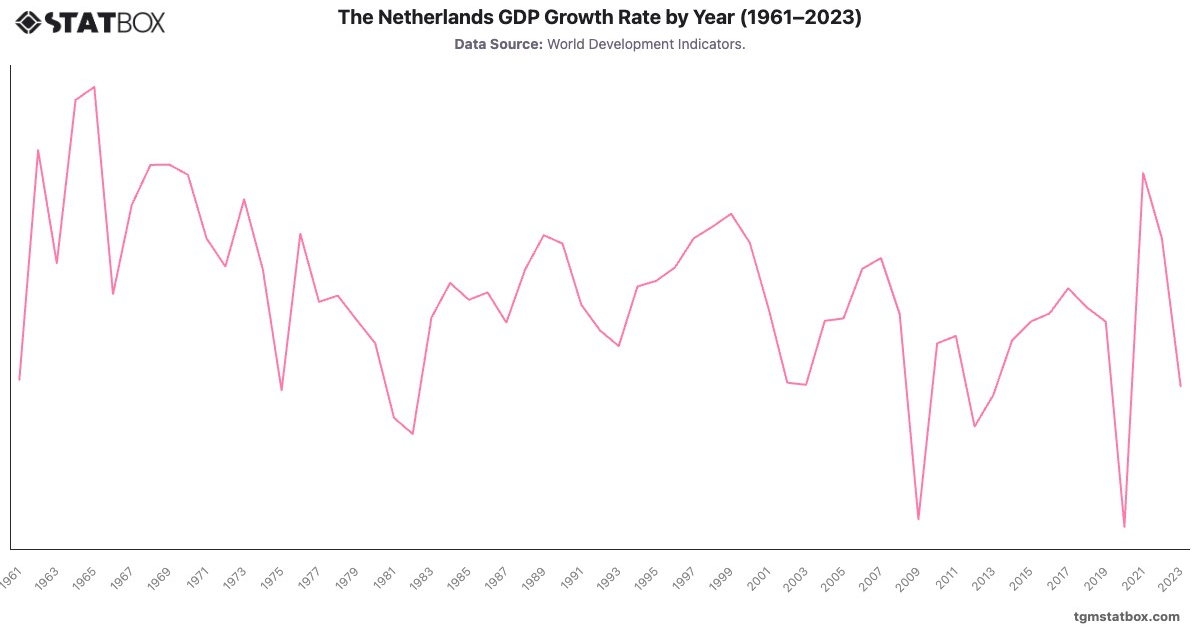
For a deeper dive into the topic, explore Netherlands’ annual GDP growth rate, Netherlands’ population density, Netherlands’s population count.