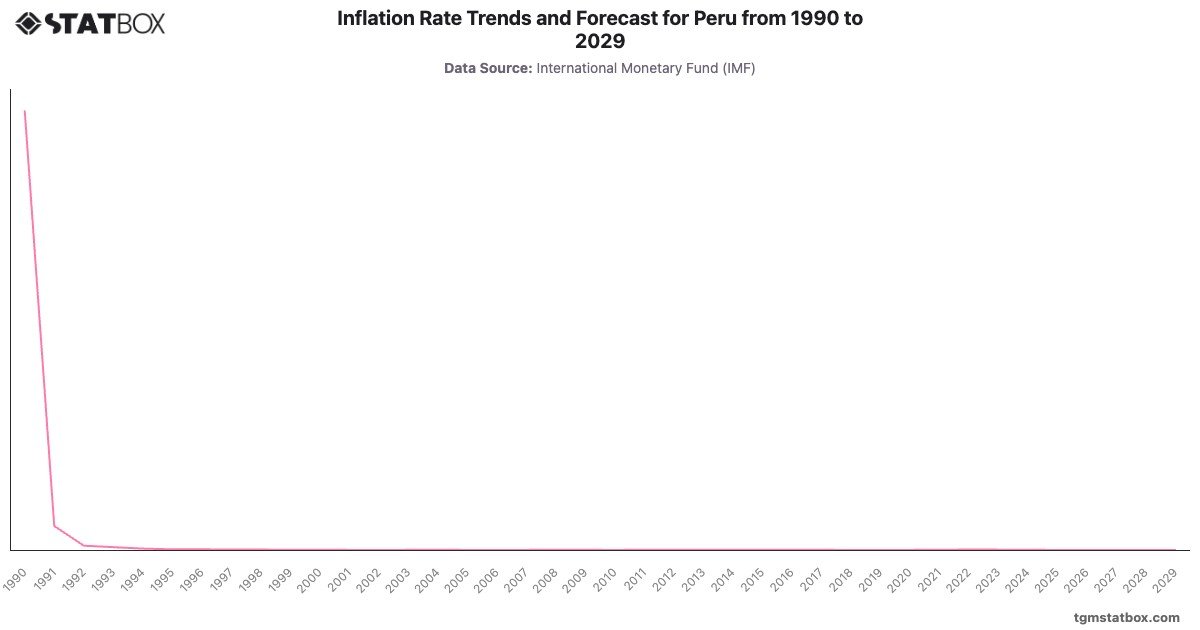
Peru experienced hyperinflation in 1990, reaching 7,, a result of severe economic mismanagement and political instability. Reforms in the 1990s, including fiscal tightening and currency stabilization, significantly reduced inflation to by 1999. Inflation remained low and stable through the 2000s, averaging 2-.
In 2022, inflation rose to , driven by global commodity price increases and supply chain disruptions. Projections indicate inflation will stabilize at from 2026, reflecting Peru’s strong commitment to macroeconomic stability.
In 2022, inflation rose to , driven by global commodity price increases and supply chain disruptions. Projections indicate inflation will stabilize at from 2026, reflecting Peru’s strong commitment to macroeconomic stability.
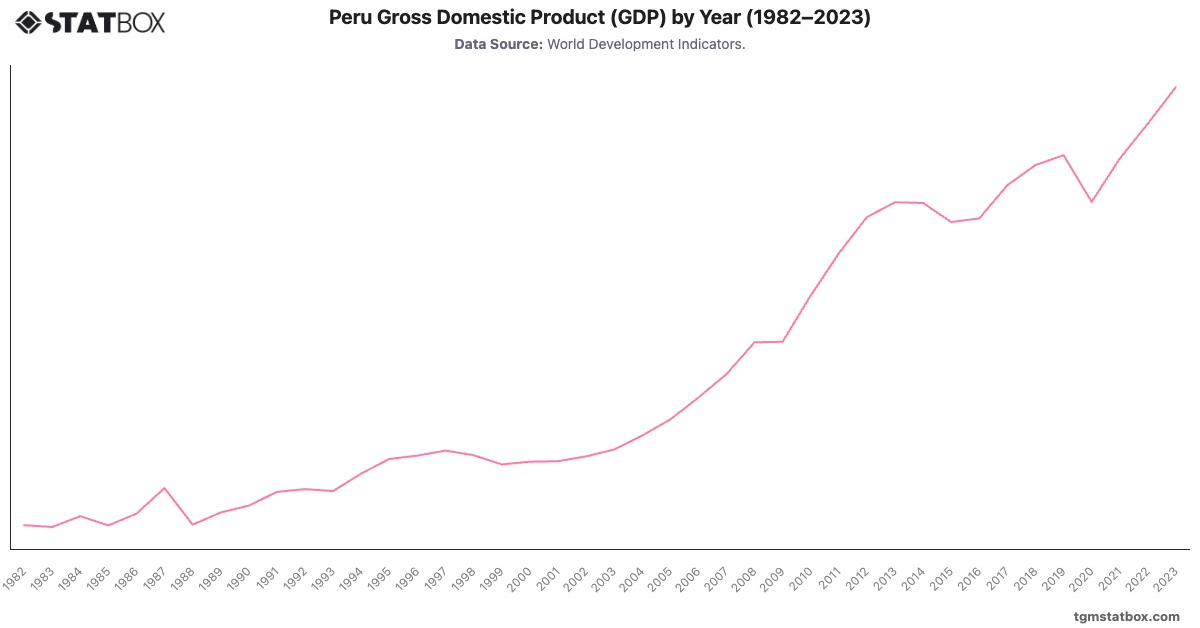
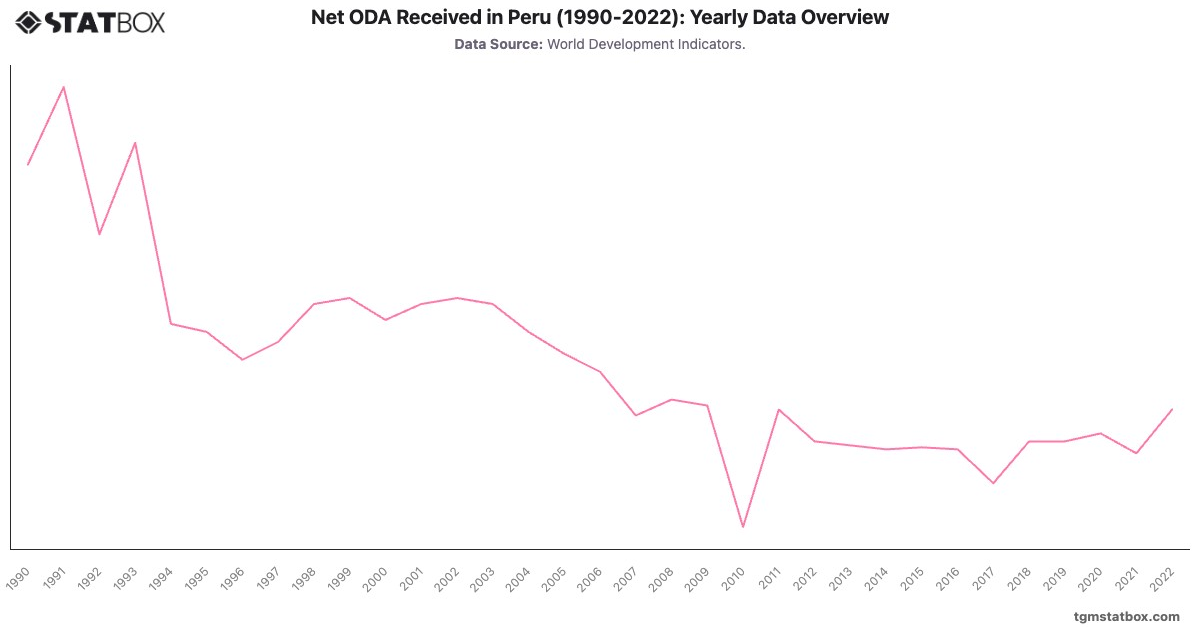
Explore related charts to gain a better understanding of Peru’s GDP % net lending/borrowing, Peru’s GDP data, Peru’s net ODA data.