Services Sector Contribution to GDP in Peru (1990-2022)

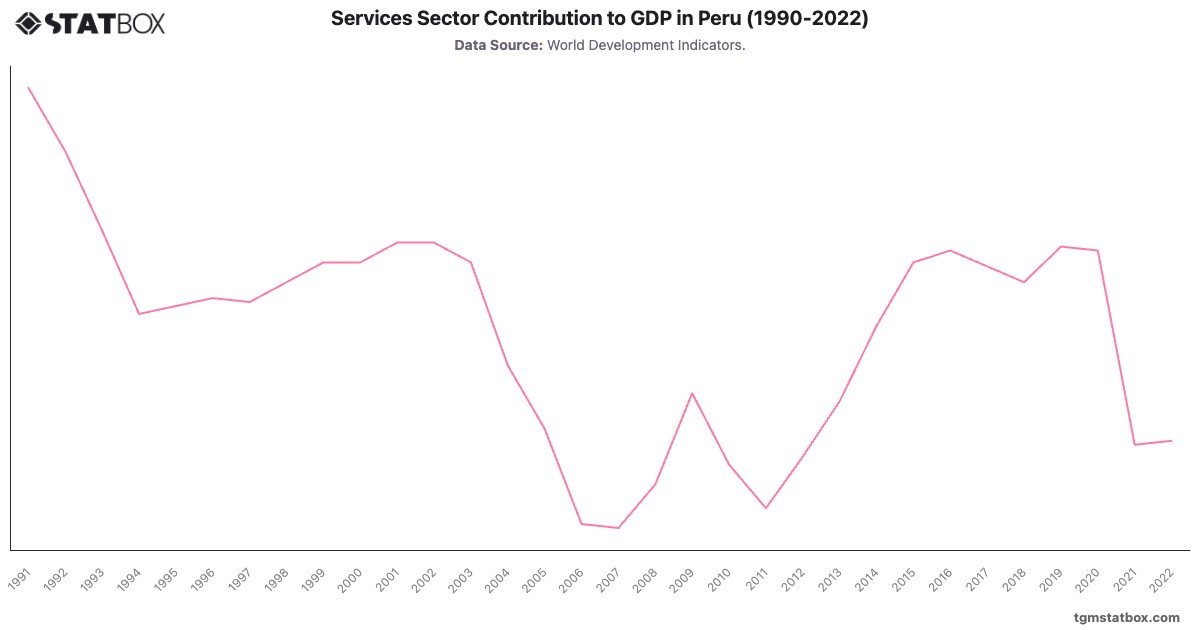
Services Sector Contribution to GDP in Peru (1990-2022)

Unlock this statistic

Log in to unlock

No account? Sign up free

Insights

Key Takeaways

Peru’s services sector showed varied contribution levels, starting from in 1991 but experiencing a significant drop to by 2007. This decrease reflects economic reforms favoring mining and agriculture over services. However, a resurgence in 2009, reaching , indicates economic diversification and tourism recovery. From 2015 onward, the services sector's contribution gradually increased, stabilizing around pre-pandemic. The sector faced challenges due to COVID-19, dropping to in 2021, though a slight recovery to in 2022 reflects government efforts to revitalize service industries amid a slow recovery.

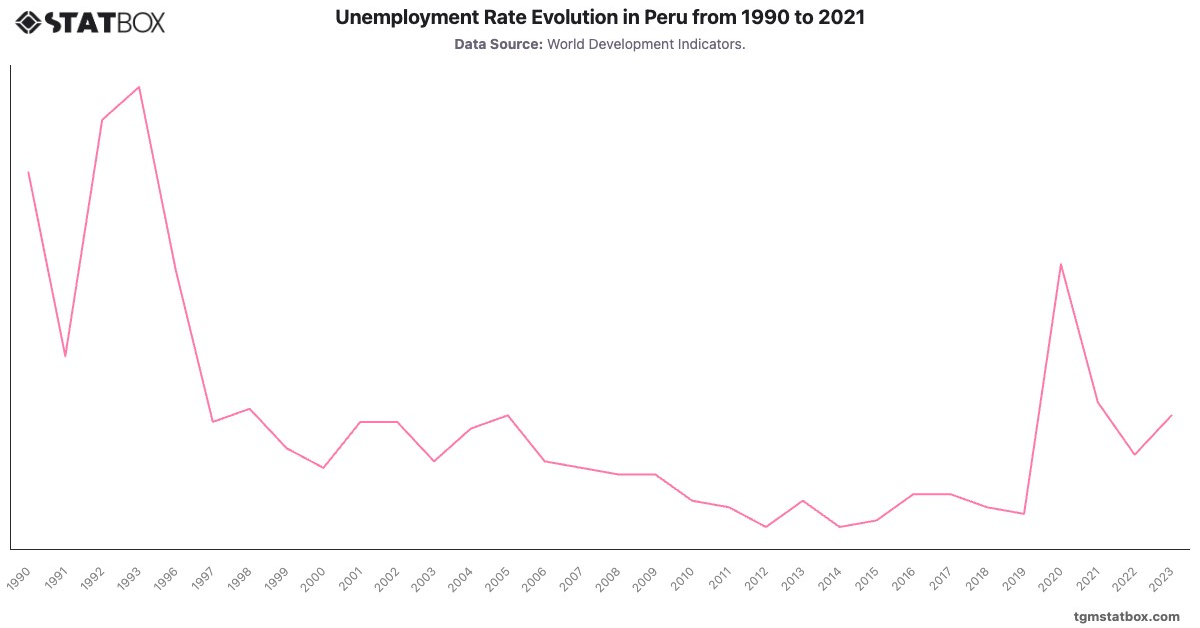
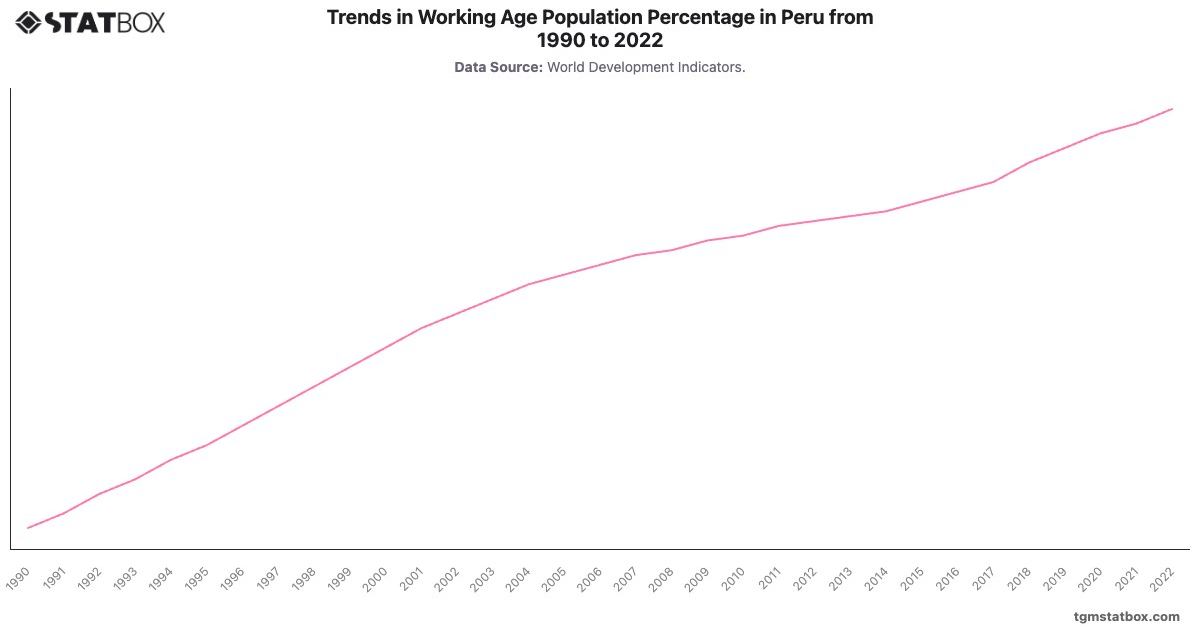
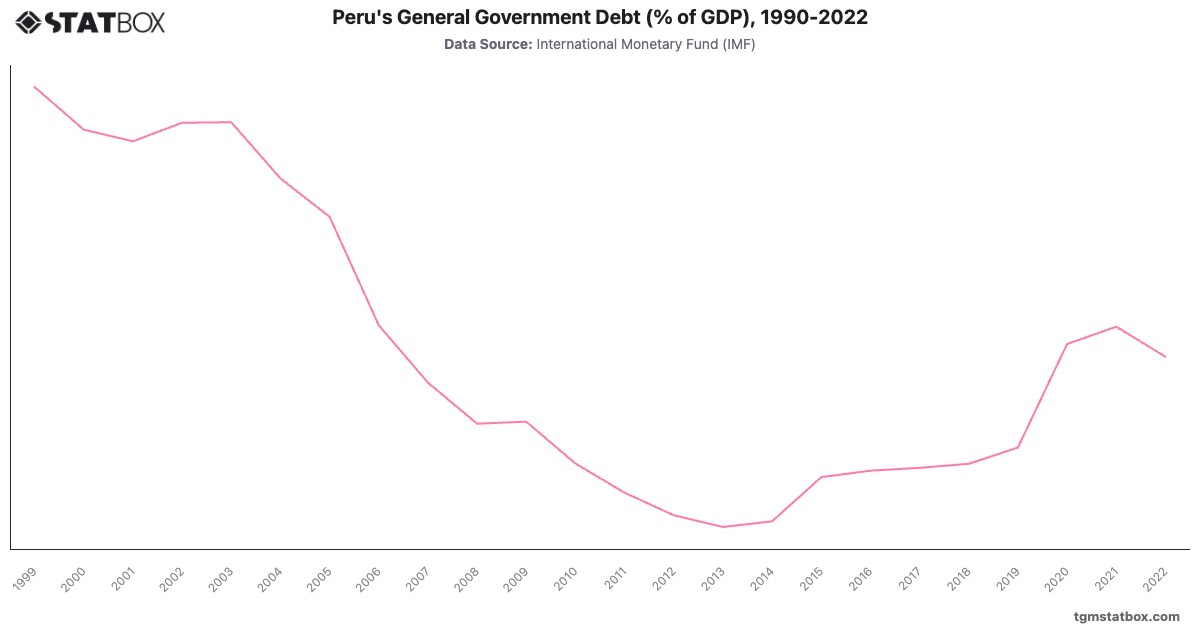
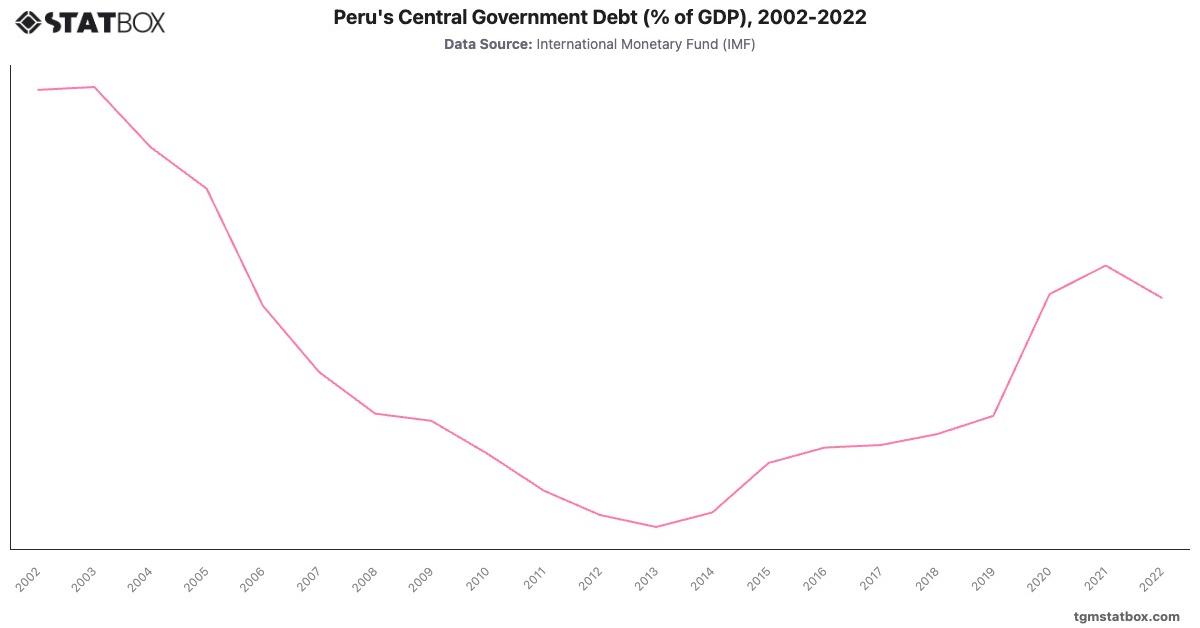
Find out more through related statistics on Percentage of working-age population in Peru, Peru’s unemployment rate, Peru’s government debt as a percent of GDP.

Would you like to know more?
Check our report on this topic

Sustainability Report: Insights in Peru

Peru Sustainability Insights Report 2024

Sustainability Report: Insights in Peru

Discover how people in Peru think and act on sustainability. TGM delivers localized, data-driven insights to support responsible business decisions and global impact.

Go to report

Further Recommended Statistics

Statbox vector
Statbox |form contact icon

Have Other Queries?

Statbox vector

Connect with our expert team for immediate assistance or comprehensive market analysis. We are always ready to support your business needs.