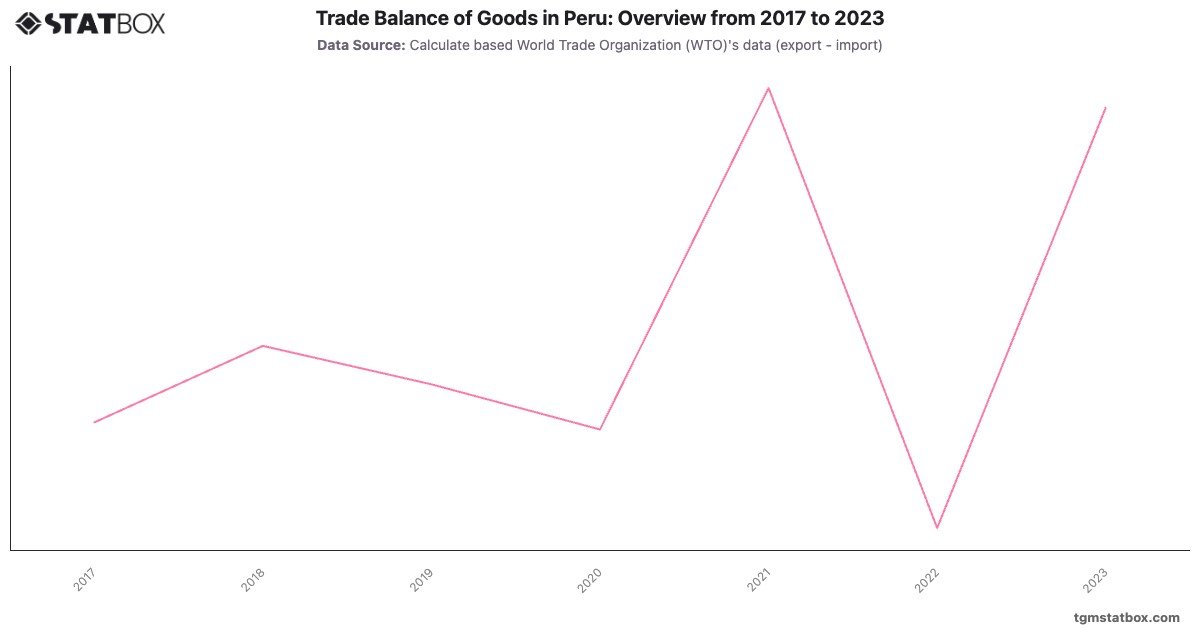
Peru consistently recorded trade surpluses, with notable fluctuations from 3,569.4 million USD in 2017 to a high of 8,757.3 million USD in 2021, supported by strong exports of copper, gold, and agricultural products. However, the surplus dipped to 1,931.6 million USD in 2022, reflecting lower commodity prices and increased import costs.
By 2023, the surplus rebounded to 8,450.5 million USD, driven by recovering global demand for Peru’s mineral and agricultural exports. Peru’s trade performance underscores the country’s dependence on resource exports, making its trade balance highly sensitive to global commodity market trends.
By 2023, the surplus rebounded to 8,450.5 million USD, driven by recovering global demand for Peru’s mineral and agricultural exports. Peru’s trade performance underscores the country’s dependence on resource exports, making its trade balance highly sensitive to global commodity market trends.
For a broader context, visit other statistics on Peru’s import value, Peru’s population stats, Peru’s GDP % net lending/borrowing.