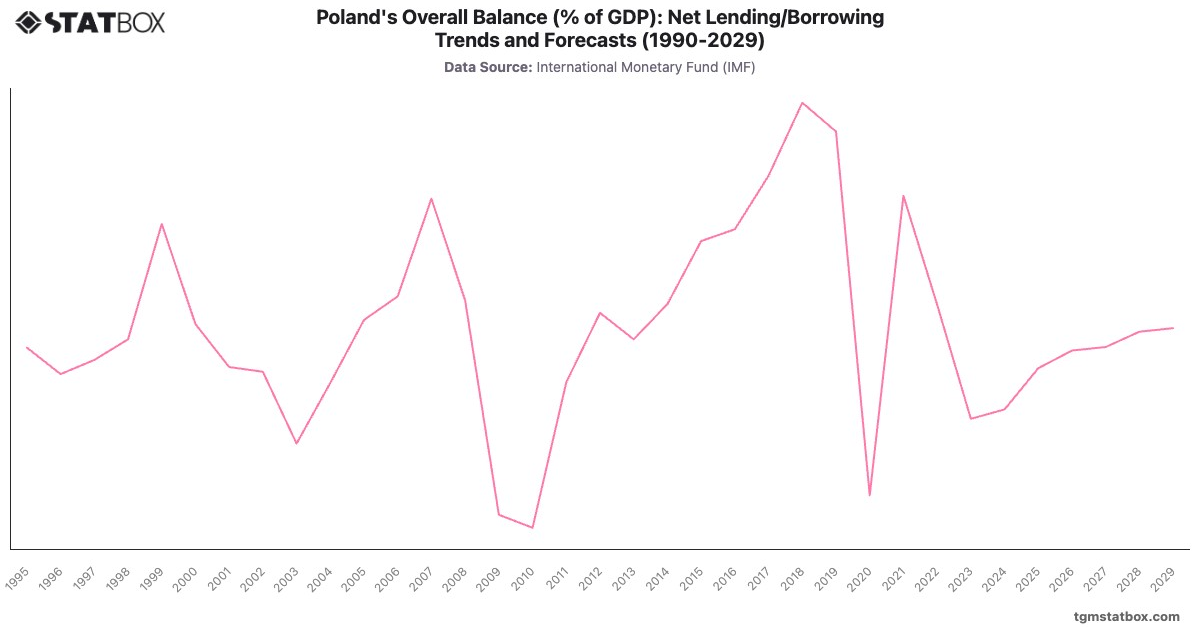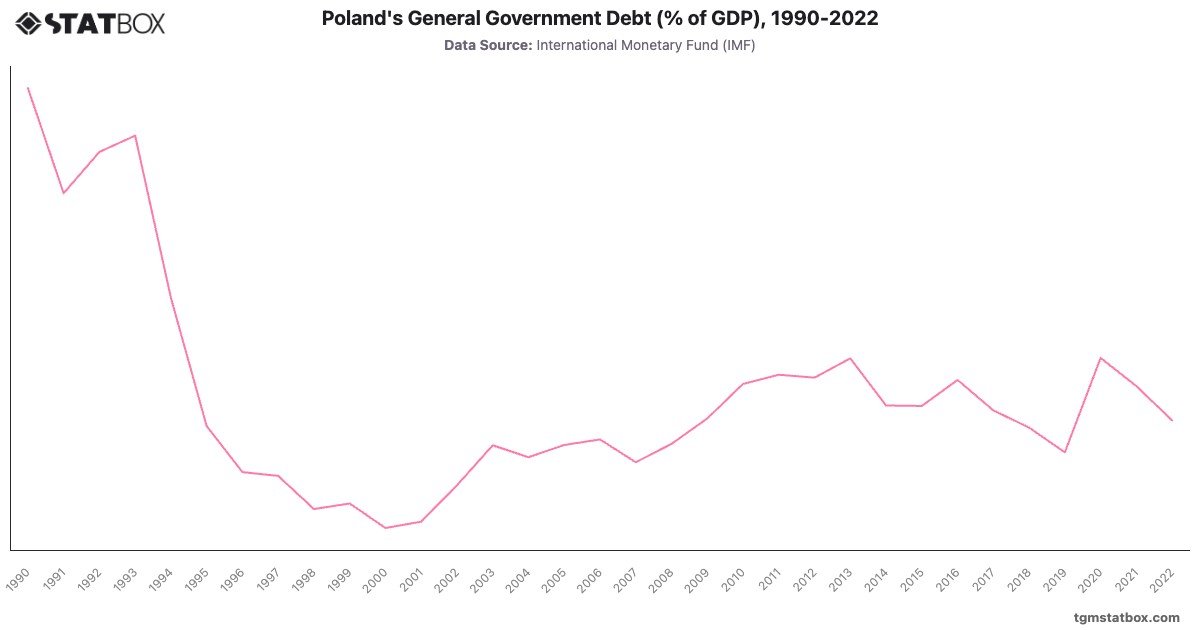
Poland's debt-to-GDP ratio demonstrated significant fluctuations from 1990 to 2022, beginning with a high of in 1990. Efforts to stabilize and restructure the economy in the early 1990s led to a steady decline, with debt levels falling to by 1997. By 2000, Poland's debt dropped further to due to economic reforms and improvements in fiscal policy.
However, the 2008 financial crisis led to increased government borrowing, resulting in a gradual rise in debt-to-GDP, peaking at in 2013. Poland managed to reduce its debt ratio in subsequent years, hitting by 2019. The COVID-19 pandemic brought another spike, raising the ratio to in 2020 due to increased spending on health and economic recovery measures. By 2022, Poland’s debt had decreased to , indicating a shift back toward fiscal consolidation.
However, the 2008 financial crisis led to increased government borrowing, resulting in a gradual rise in debt-to-GDP, peaking at in 2013. Poland managed to reduce its debt ratio in subsequent years, hitting by 2019. The COVID-19 pandemic brought another spike, raising the ratio to in 2020 due to increased spending on health and economic recovery measures. By 2022, Poland’s debt had decreased to , indicating a shift back toward fiscal consolidation.
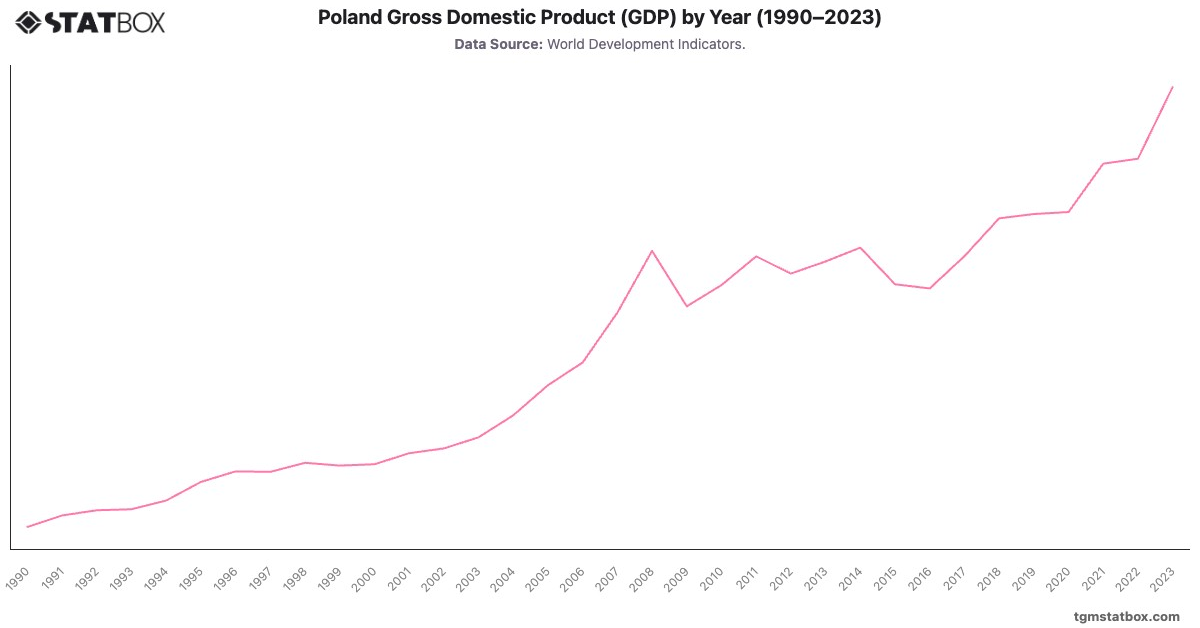
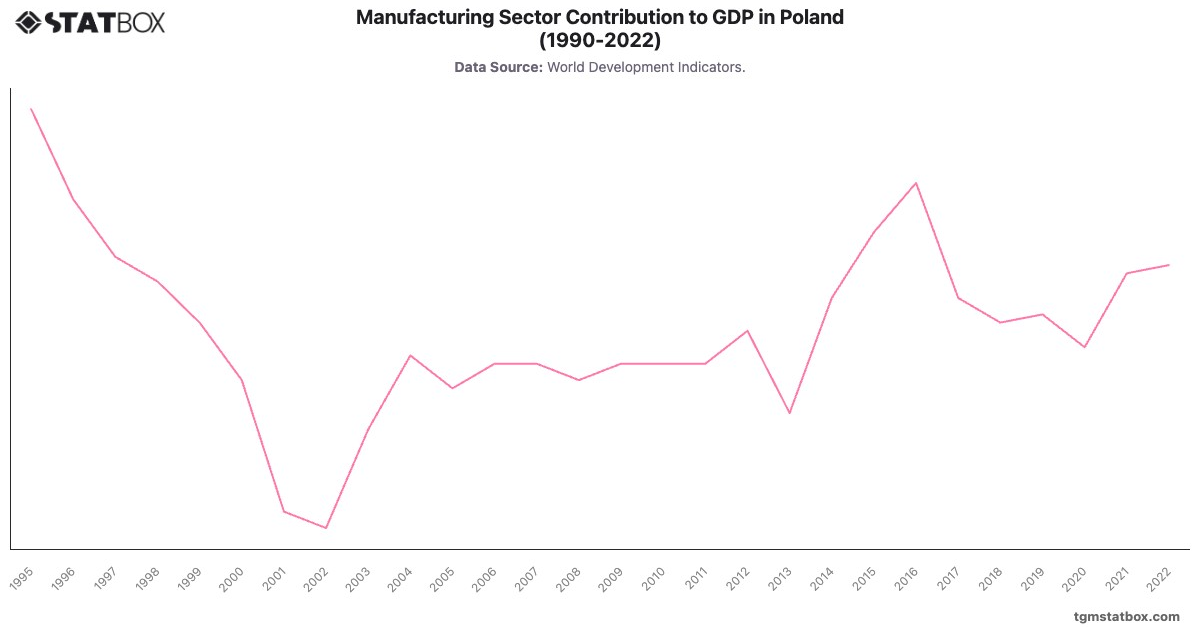
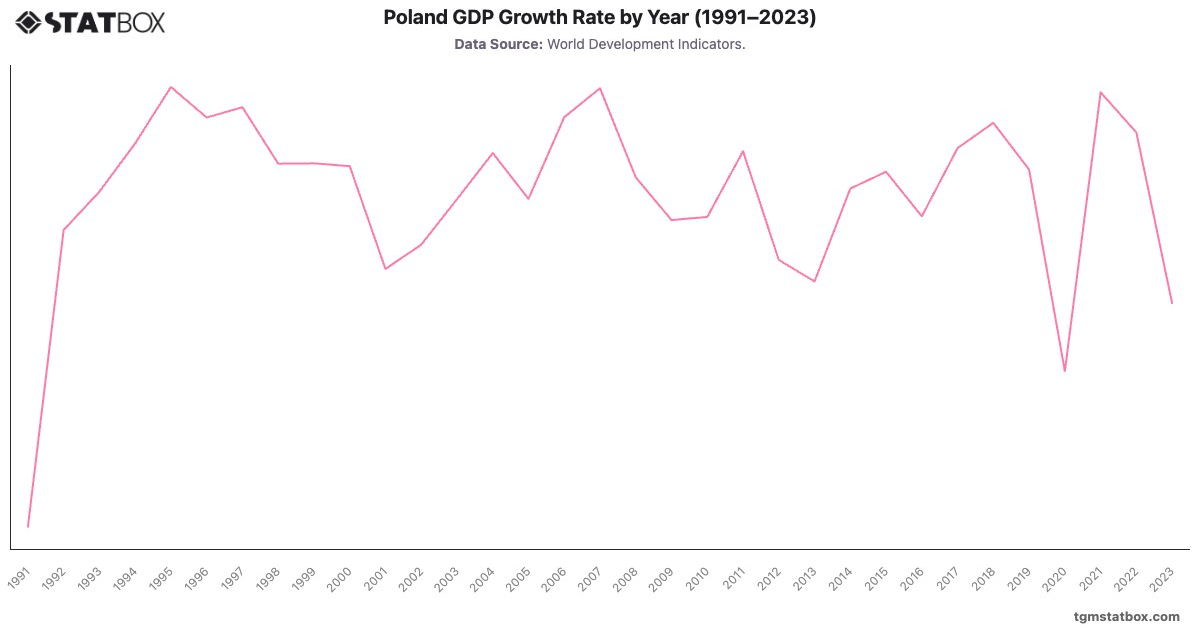
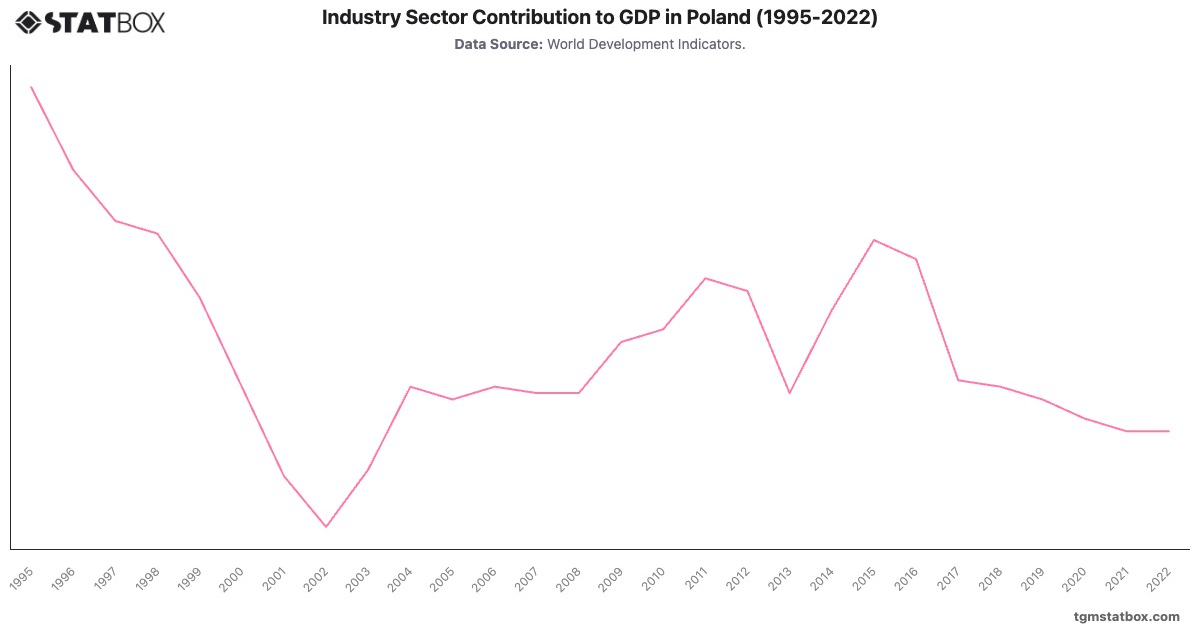
For a broader context, visit other statistics on Poland’s annual GDP growth rate, Poland’s manufacturing sector’s GDP contribution, military personnel ratio in Poland.