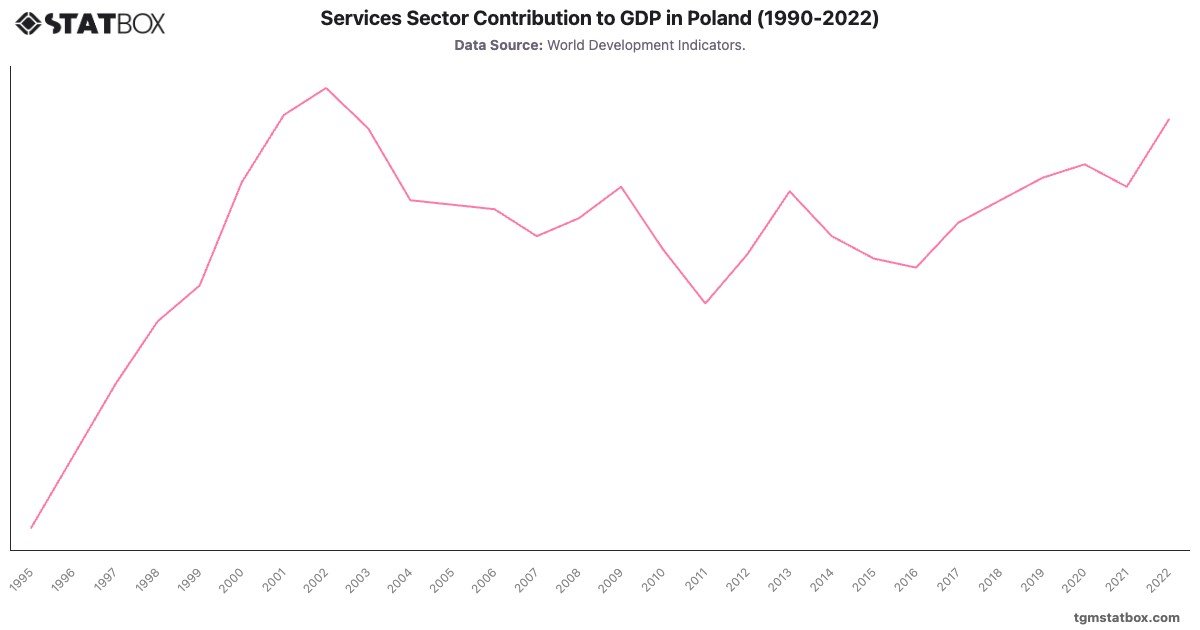
Poland’s services sector displayed notable growth from the mid-1990s onward. The sector's contribution to GDP increased significantly, from in 1995 to a peak of by 2002. This rise reflects Poland's transition from a state-controlled economy to a more diversified, market-driven system after joining the European Union. However, the 2004 EU accession brought increased competition, causing a slight decline in services' GDP share, reaching in 2004. Subsequent fluctuations, including a dip to in 2011, were partly due to economic restructuring and adjustments to the global financial crisis of 2008-2009. The period following 2015 saw renewed growth, with services stabilizing around 56-, partly driven by expansion in technology and finance. By 2022, services contributed , marking resilience and adaptability in Poland’s economy, particularly as it navigates EU economic dynamics and emerging digital industries.
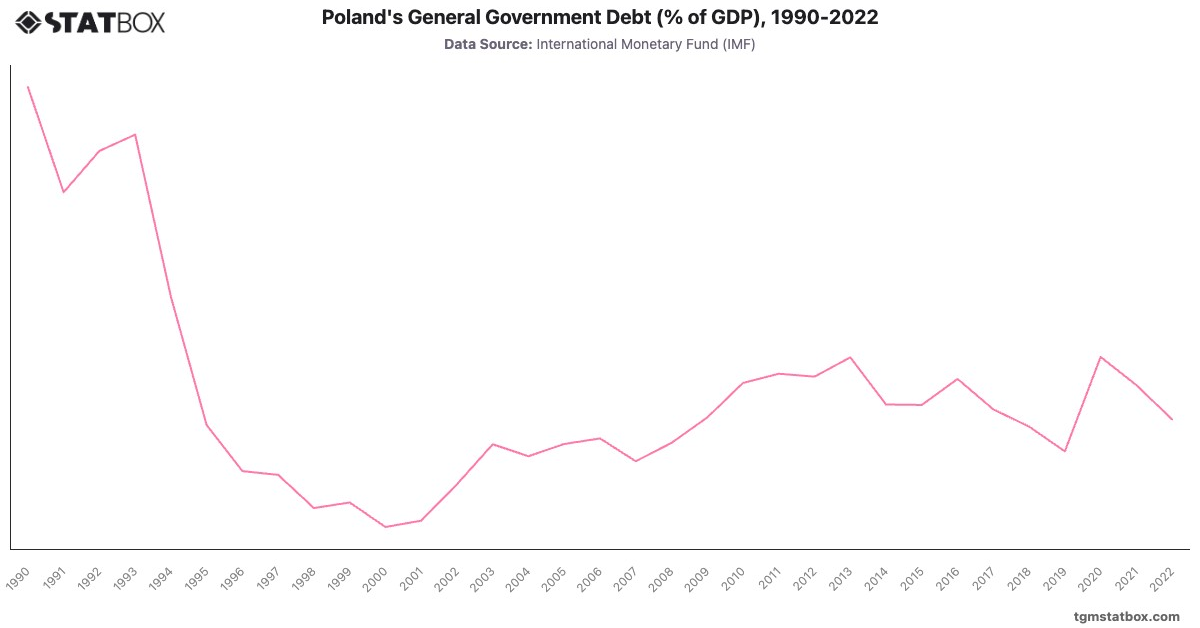
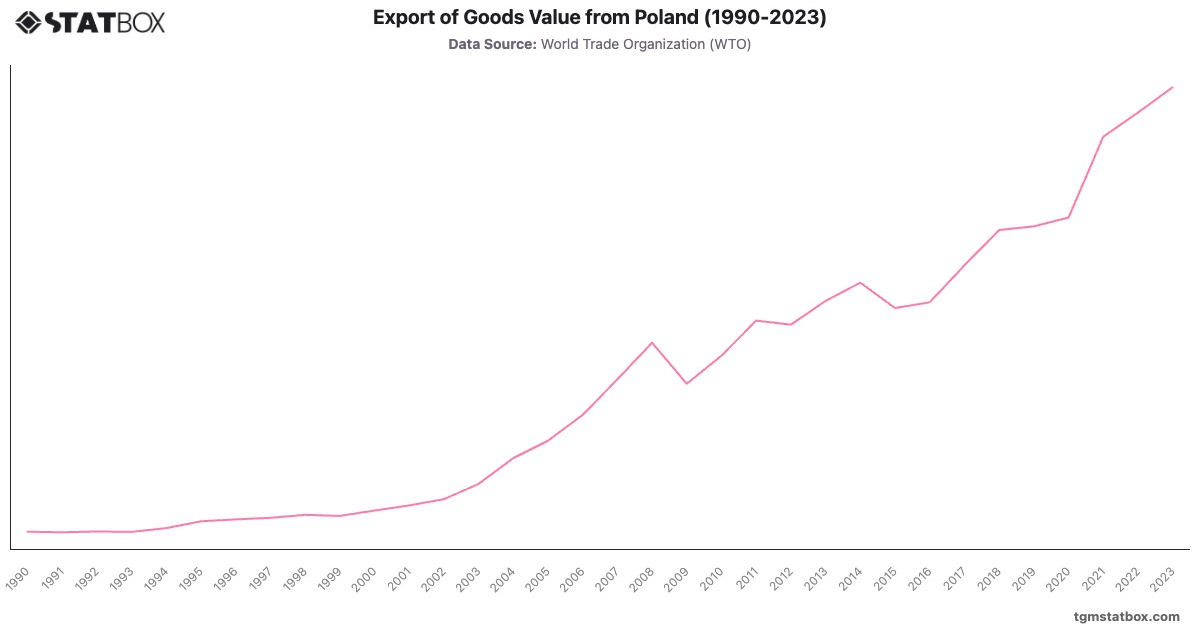
Explore related charts to gain a better understanding of Poland’s goods export value, Poland’s general government debt-to-GDP ratio, Poland’s manufacturing sector’s GDP contribution.