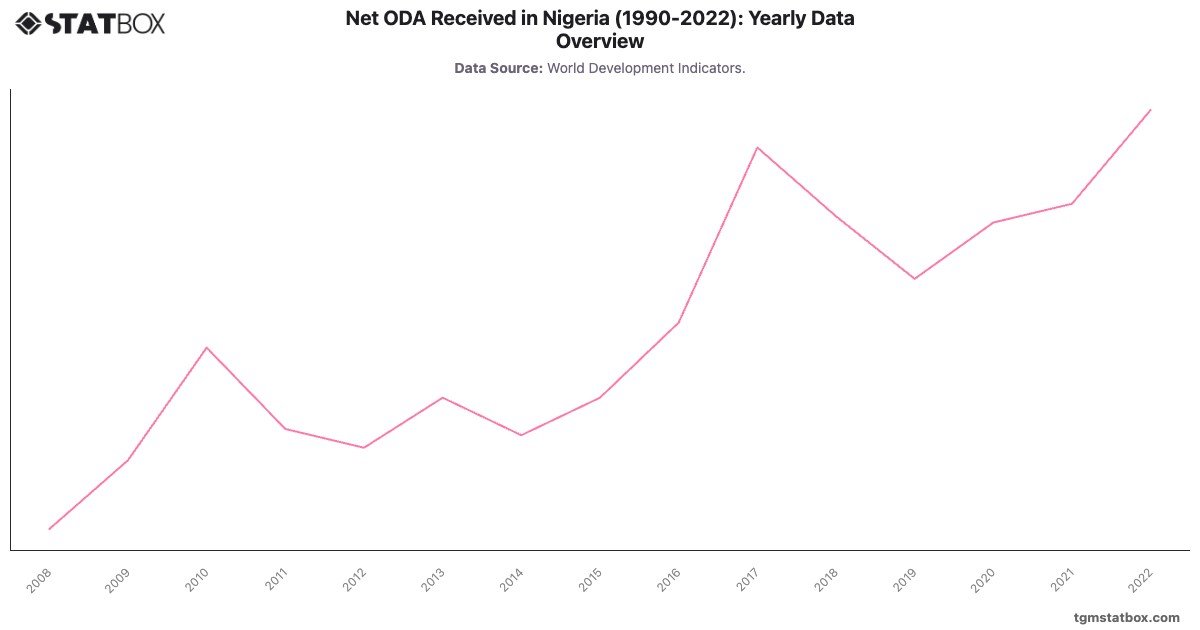
Nigeria's Net ODA (% of GNI) has remained modest, reflecting its status as Africa’s largest economy with significant oil revenues. ODA levels increased from in 2008 to in 2022, indicating consistent donor engagement to address challenges such as poverty, infrastructure deficits, and insurgency in the northern regions.
Key increases, such as in 2017, correspond to international support for combating Boko Haram and improving humanitarian conditions. Continued ODA contributions reflect Nigeria’s complex development needs, balancing its economic potential with persistent inequality and governance issues.
Key increases, such as in 2017, correspond to international support for combating Boko Haram and improving humanitarian conditions. Continued ODA contributions reflect Nigeria’s complex development needs, balancing its economic potential with persistent inequality and governance issues.
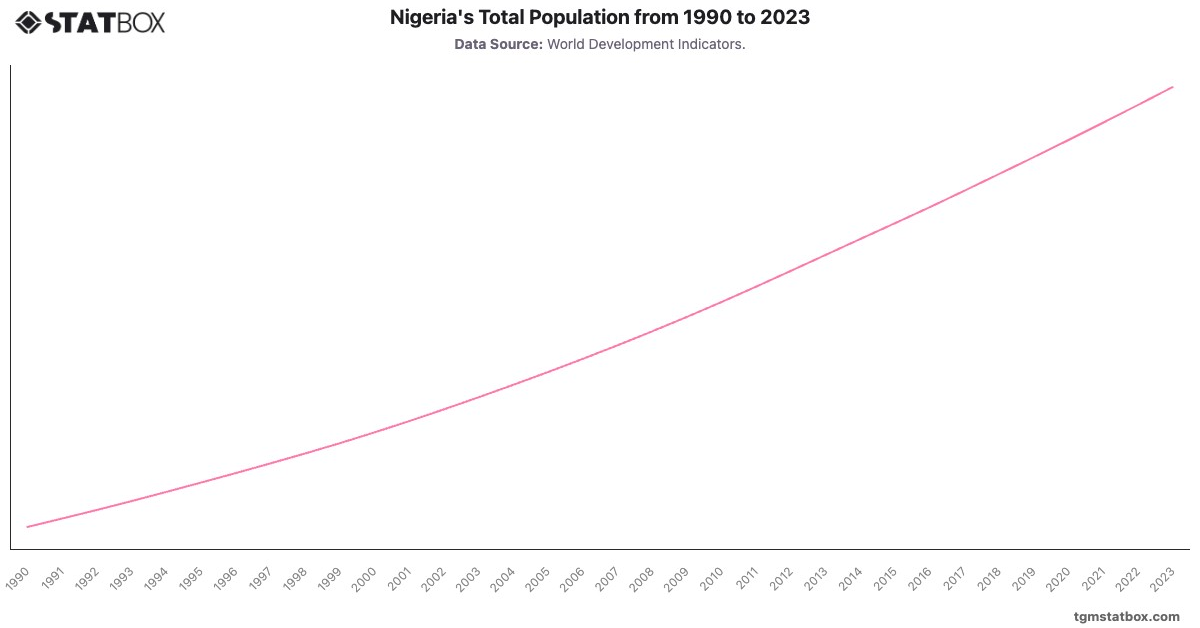
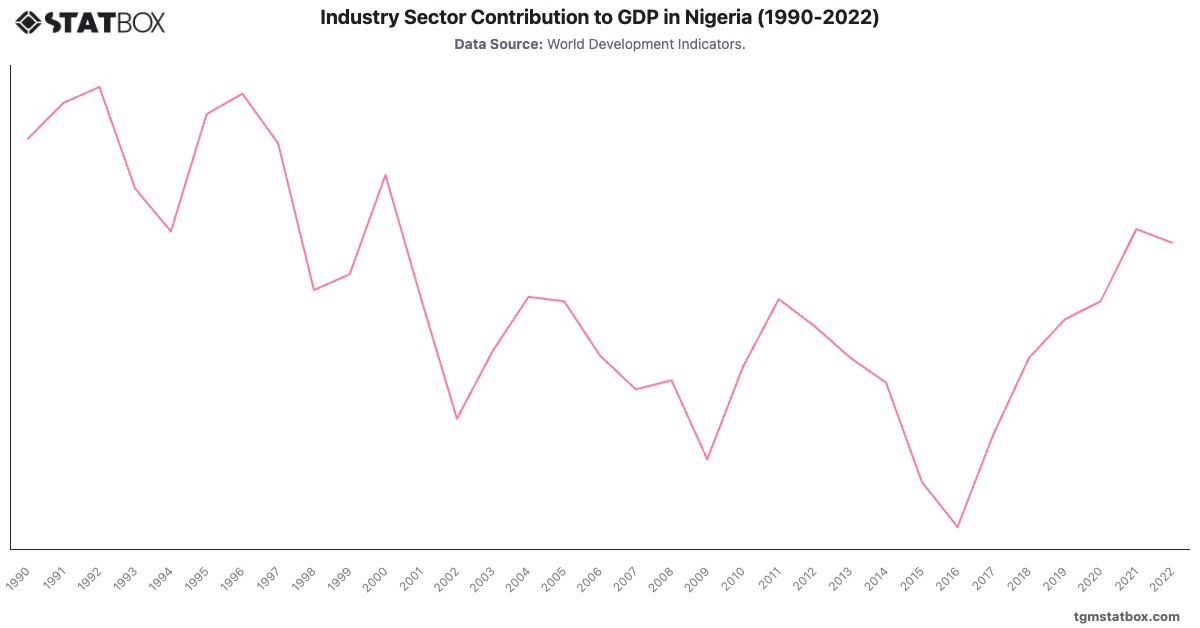
Discover additional trends and data on Nigeria’s population numbers, Nigeria’s industry sector GDP contribution, Nigeria’s birth life span.