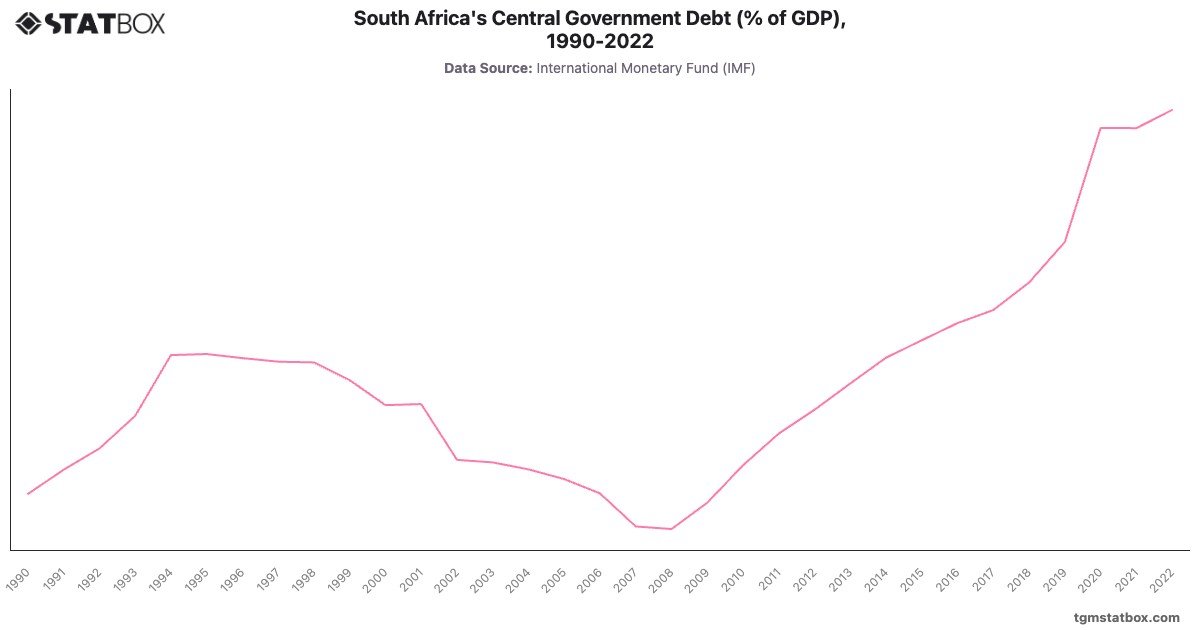
South Africa's central government debt rose from in 1990 to in 1995, reflecting the fiscal pressures of transitioning from apartheid. Between 1996 and 2008, debt declined to due to fiscal consolidation and economic reforms. However, the 2009 global financial crisis pushed debt back up, reaching by 2011.
From 2012 onward, rising fiscal deficits and low economic growth caused debt to climb steadily, peaking at in 2022. This increase was accelerated by the COVID-19 pandemic, which necessitated additional borrowing to fund healthcare and economic support measures.
From 2012 onward, rising fiscal deficits and low economic growth caused debt to climb steadily, peaking at in 2022. This increase was accelerated by the COVID-19 pandemic, which necessitated additional borrowing to fund healthcare and economic support measures.
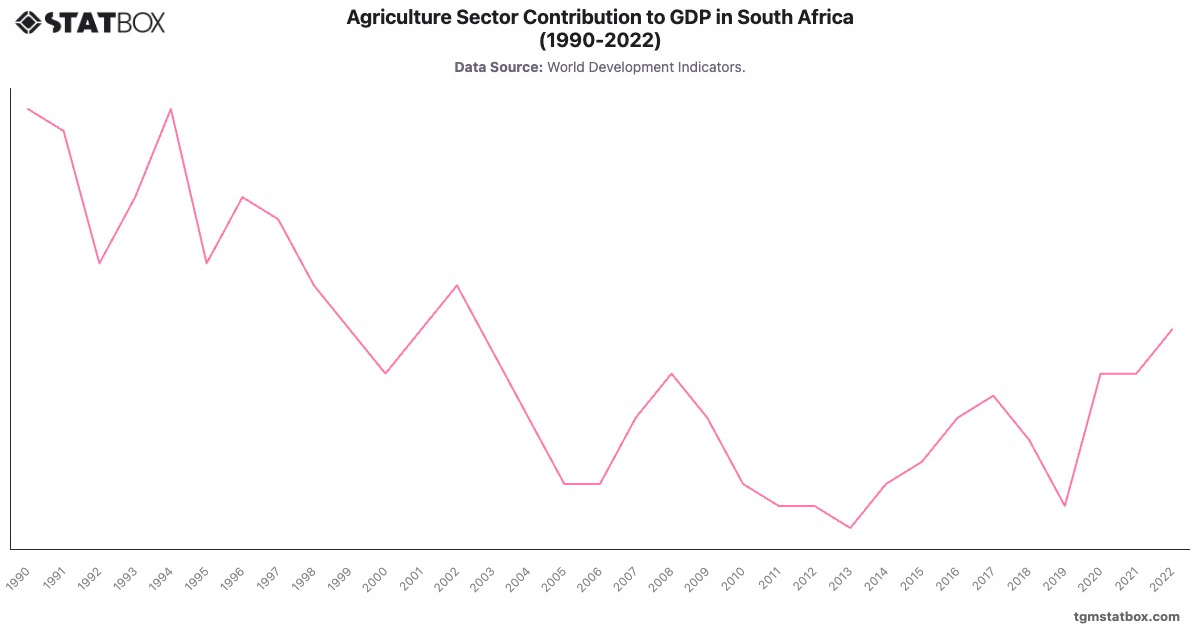
For additional information, visit statistics on South Africa’s GDP (%): net lending/borrowing forecast, agriculture’s share in South Africa’s GDP, South Africa’s annual GDP growth rate.