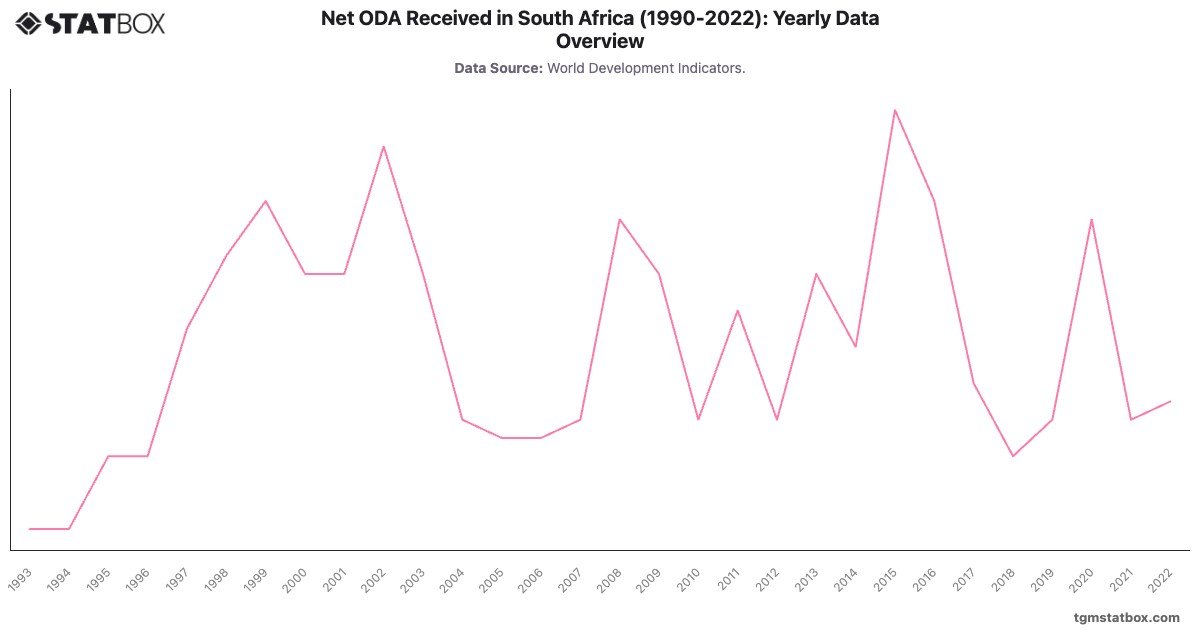
South Africa’s Net ODA (% of GNI) remained low and stable throughout the period, peaking briefly at in 2008 and 2020. These increases align with donor support during the global financial crisis and COVID-19 pandemic.
The consistently low levels underscore South Africa’s position as a middle-income country capable of financing its development while benefiting from targeted international support for specific programs, such as HIV/AIDS initiatives.
The consistently low levels underscore South Africa’s position as a middle-income country capable of financing its development while benefiting from targeted international support for specific programs, such as HIV/AIDS initiatives.
For a deeper dive into the topic, explore military personnel share in South Africa’s population, agriculture’s share in South Africa’s GDP, South Africa’s fertility rate trends.