United Kingdom GDP Growth Rate by Year (1961-2023)
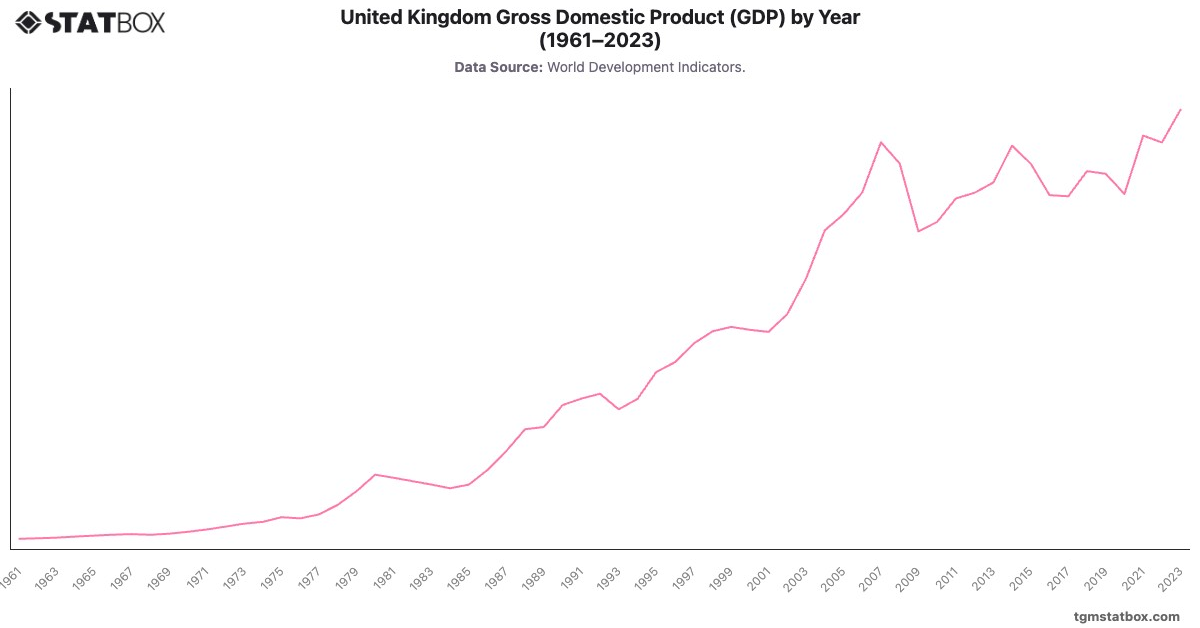
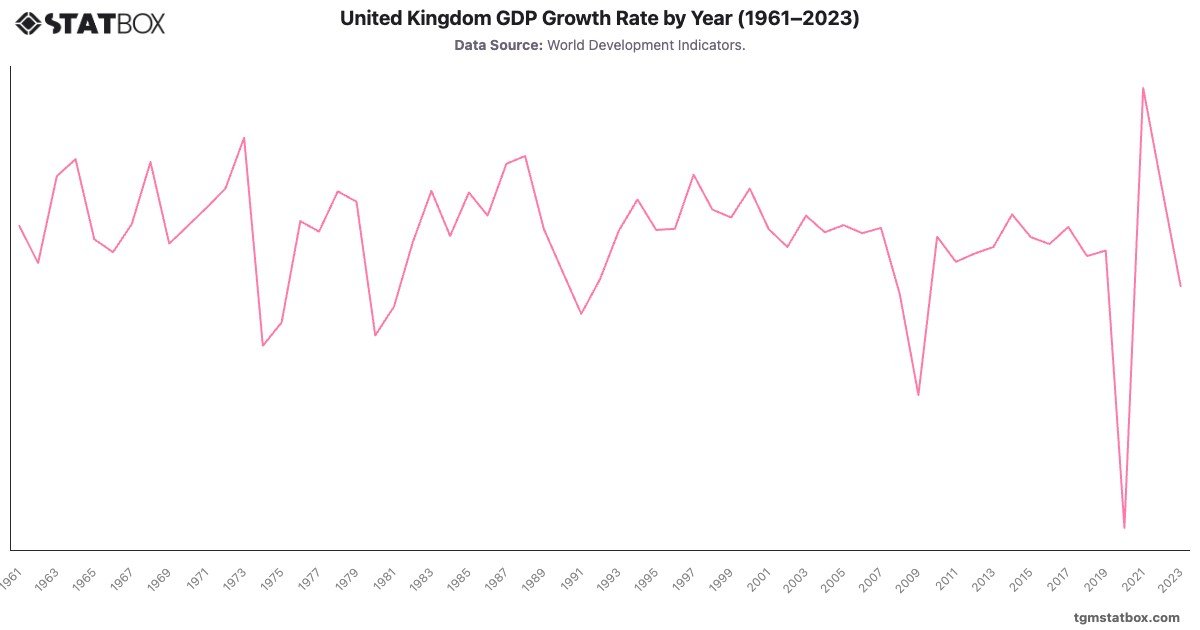
The UK's GDP growth has witnessed wide swings. The 1960s were marked by steady expansion, but oil shocks and industrial challenges caused recessions in 1974 and 1980. The economy picked up in the late 1980s, peaking at in 1988. However, the early 1990s recession and 2008 financial crisis severely impacted growth, with a notable - contraction in 2009.
In 2020, the pandemic caused an unprecedented - fall. A strong recovery followed in 2021 with , though momentum slowed, registering just in 2023 as Brexit and global uncertainties continued to influence economic performance.
Find out more through related statistics on United Kingdom’s annual GDP data, UK’s net lending/borrowing as a share of GDP, United Kingdom's unemployment rate changes.