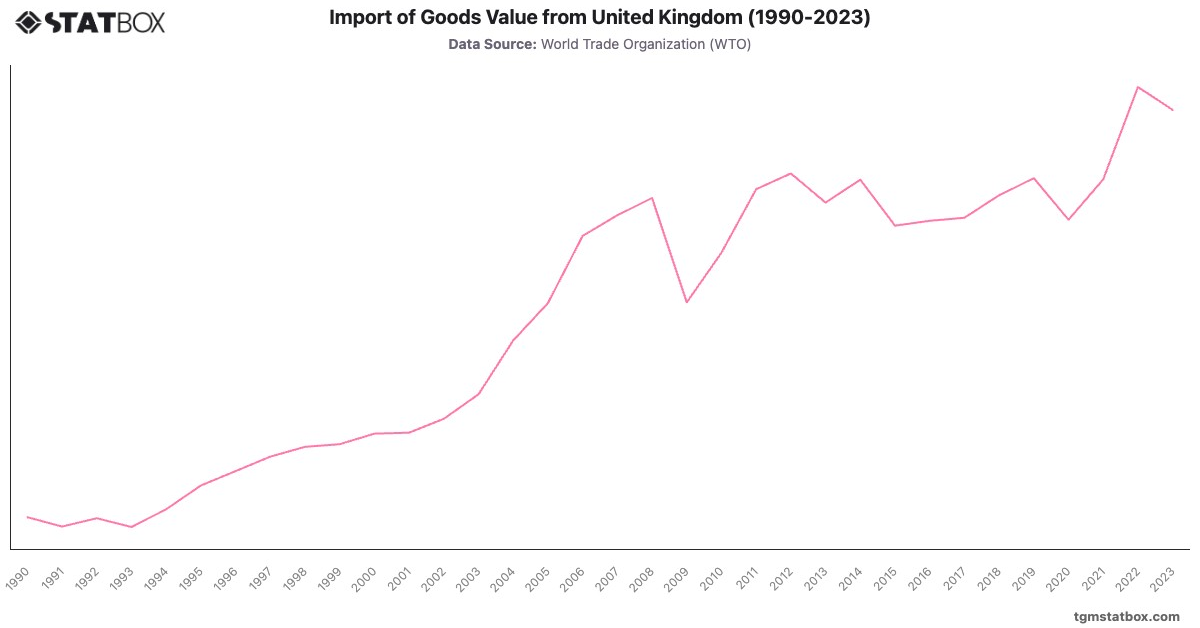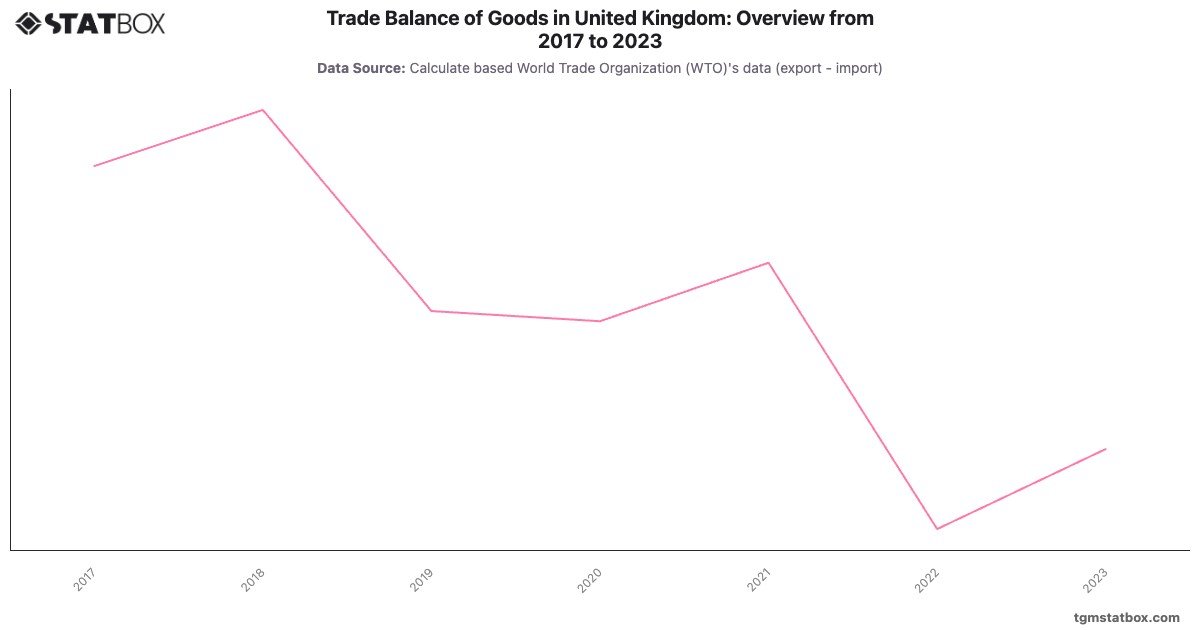
The UK’s trade deficit widened significantly between 2017 and 2023, increasing from -200,005.3 million USD in 2017 to -290,564.9 million USD in 2022, driven by rising energy imports and post-Brexit disruptions to trade. In 2023, the deficit narrowed slightly to -270,611.0 million USD, reflecting stabilizing energy prices and some recovery in manufacturing exports.
The UK’s trade balance highlights challenges posed by its reliance on imported goods and energy, coupled with reduced trade competitiveness post-Brexit. Continued focus on export growth and reducing import dependency will be critical for narrowing the deficit.
The UK’s trade balance highlights challenges posed by its reliance on imported goods and energy, coupled with reduced trade competitiveness post-Brexit. Continued focus on export growth and reducing import dependency will be critical for narrowing the deficit.
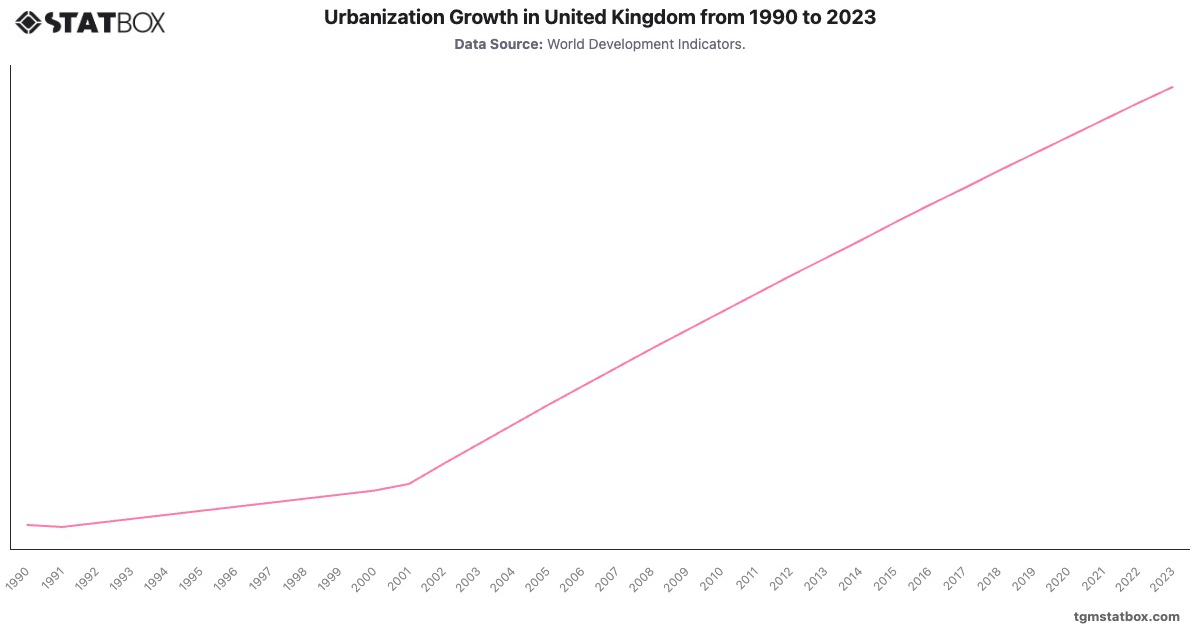
Explore related charts to gain a better understanding of Urbanization trends in the UK, United Kingdom’s population, United Kingdom’s annual GDP growth rate.