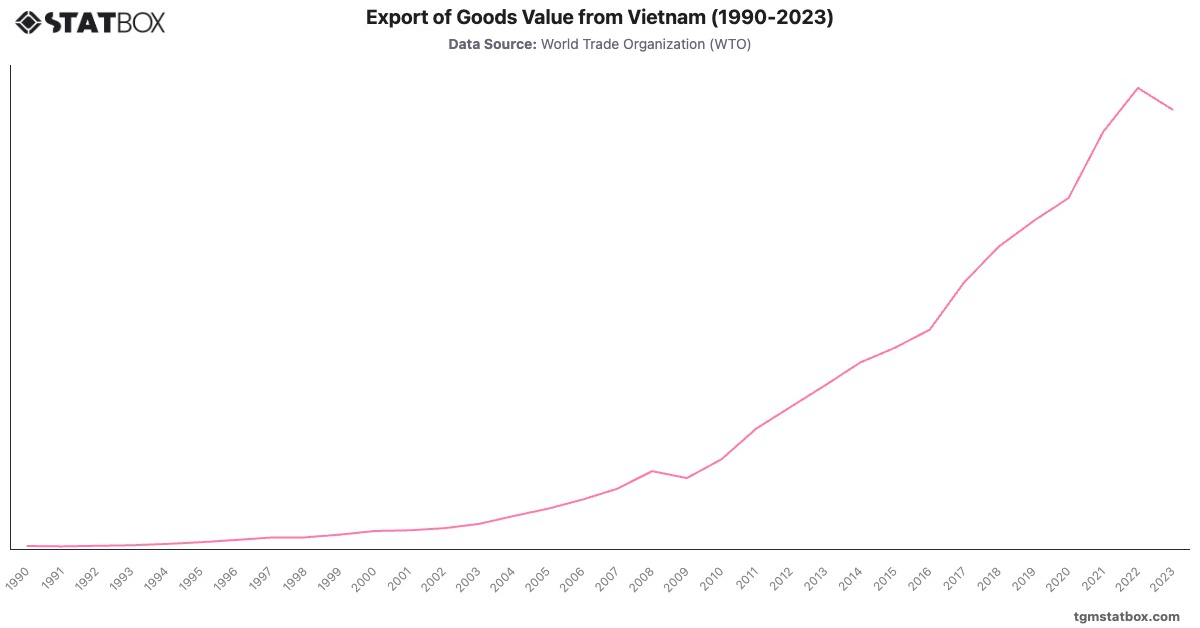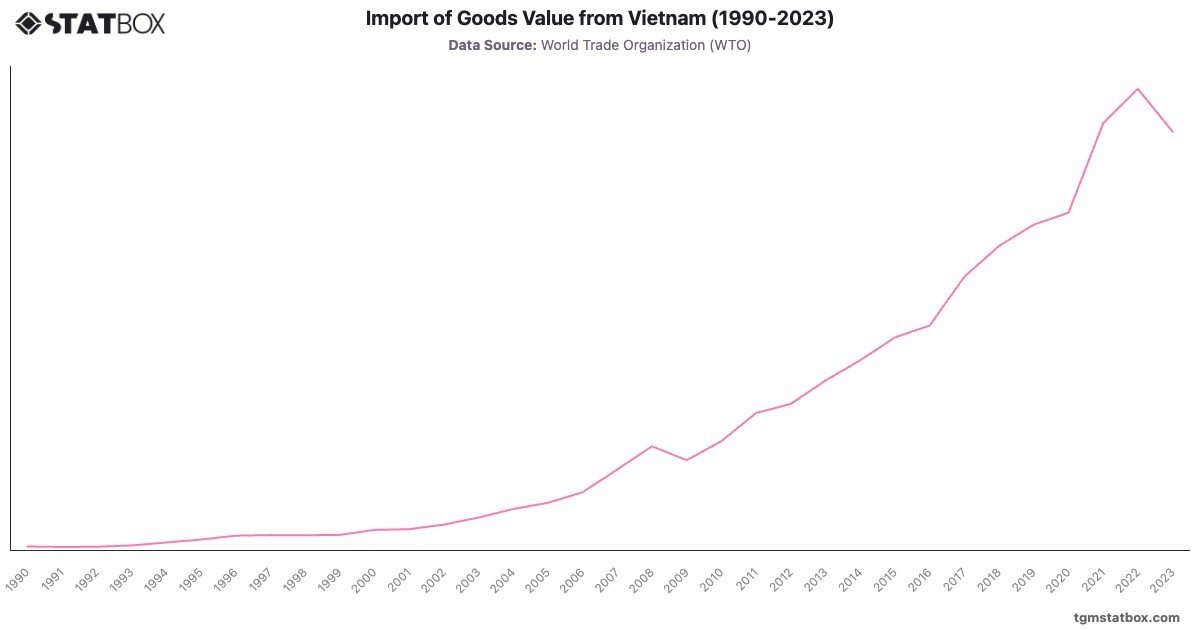
Viet Nam's imports grew exponentially from $2.8B in 1990 to $359.1B in 2022, reflecting its rapid economic transformation and integration into global trade. The 1990s saw significant growth, with imports increasing from $3.5B in 1993 to $11.7B in 1999, fueled by industrialization and investment-driven development.
The 2000s marked further acceleration, with imports reaching $80.7B in 2008, supported by expanding manufacturing and exports. Despite a dip during the 2009 global financial crisis, imports rebounded, peaking at $359.1B in 2022. The 2023 figure of $325.8B reflects stabilization in trade flows amid shifting global supply chain dynamics. Viet Nam’s rise underscores its growing role as a manufacturing hub and trade partner.
The 2000s marked further acceleration, with imports reaching $80.7B in 2008, supported by expanding manufacturing and exports. Despite a dip during the 2009 global financial crisis, imports rebounded, peaking at $359.1B in 2022. The 2023 figure of $325.8B reflects stabilization in trade flows amid shifting global supply chain dynamics. Viet Nam’s rise underscores its growing role as a manufacturing hub and trade partner.
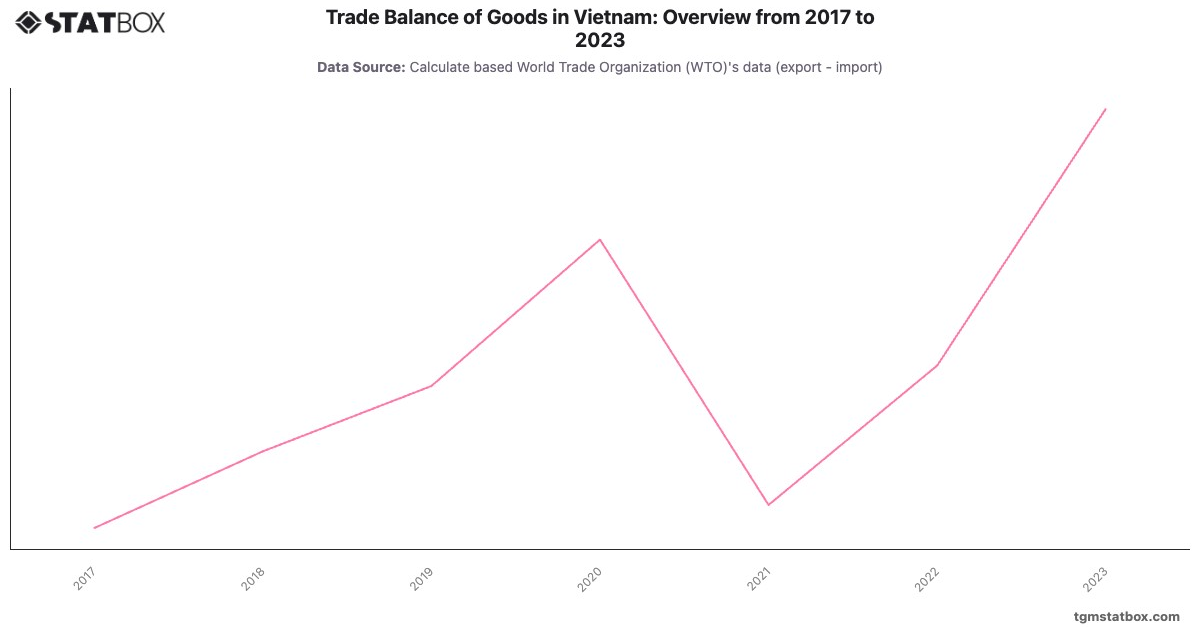
For a deeper dive into the topic, explore Vietnam’s services sector share in GDP, Vietnam’s net lending/borrowing as percentage of GDP , Vietnam’s goods trade balance.