Insights library
Not sure where to start? Dive into a diverse selection of charts and data visualizations across topics, and find the information you need to drive your research and analysis.
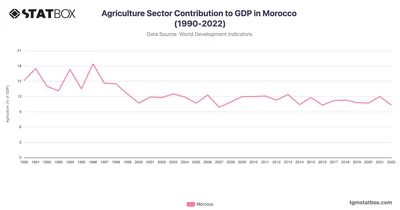
Morocco’s agriculture GDP fluctuates due to climate impact, key for rural employment. Discover the full Morocco’s agriculture GDP data at TGM StatBox.
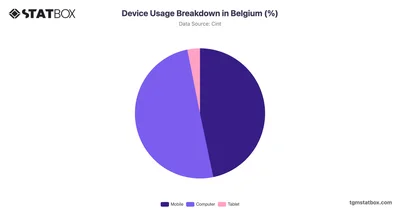
Belgium displays a relatively balanced device usage pattern, with 46.72% of users on mobile devices. Discover more about device usage breakdown in Belgium, on TGM StatBox.
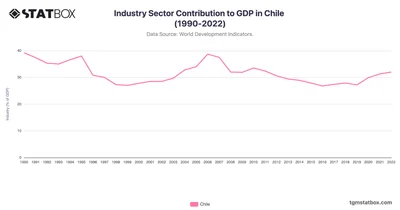
Chile's industrial sector contribution to GDP began at a high of 39.2% in 1990 but showed fluctuations over the years. Find more data about China on TGM StatBox.
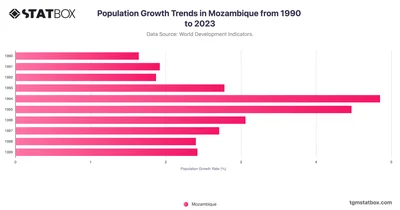
The "Population Growth Trends in Mozambique 1990-2023" chart illustrates a unique fluctuation in growth rates over years, influenced by both socio-political factors and health challenges.
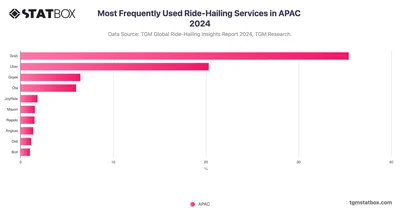
Grab leads with 35.4% of APAC users selecting it as their most-used service, a testament to its widespread popularity and dominance in the region.
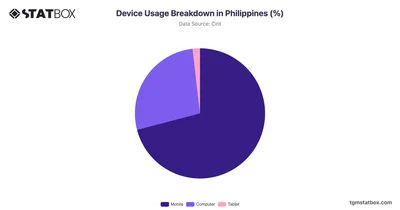
Explore device usage breakdown in the Philippines, showcasing percentage distribution of smartphones, tablets, desktops. Analyze the trends shaping digital habits.
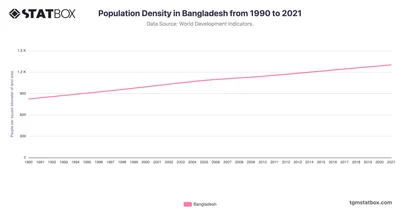
The chart highlights the rapid increase in Bangladesh’s population density from 1990 to 2021. See the full Bangladesh's population density data on TGM StatBox.
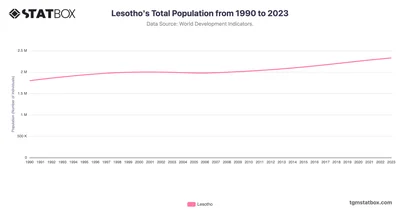
Lesotho's population growth from 1990 to 2023 reveals a nuanced pattern, marked by slow but steady increases. Learn more about Lesotho's population changes over the decades on TGM StatBox.
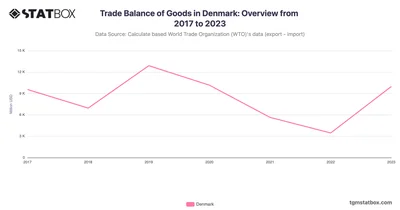
Denmark maintained a trade surplus in 2023, driven by robust exports in pharmaceuticals and machinery. Discover more statistics and insights on TGM StatBox.
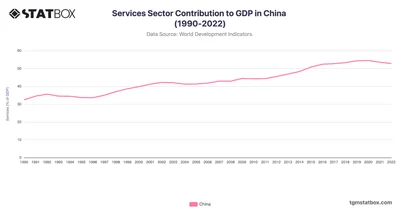
China's Services sector contribution expanded from 32.4% in 1990 to over 54% in recent years. Find more China's GDP data over the years on TGM StatBox.
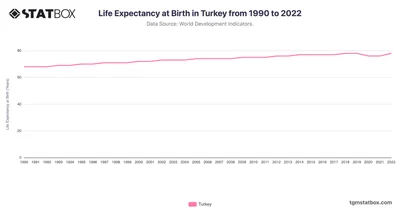
Turkey’s life expectancy rose from 68 in 1990 to 78 in 2022, supported by healthcare reforms and economic growth. Discover more statistics and insights on TGM StatBox.
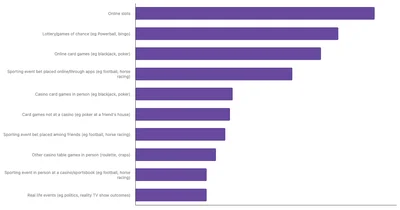

Most Common Betting Activities Among Filipinos | TGM Statbox Chart: Learn about the most common betting activities among Filipinos in TGM Statbox's chart.
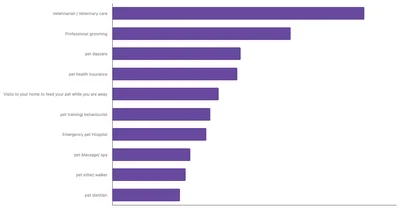
In the UAE, pet owners use a variety of pet services, with veterinary care being the most popular at 48.79%, followed by professional grooming as the second most common service.
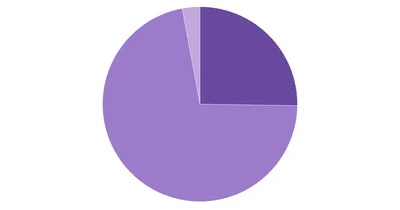
Cryptocurrency adoption in France is still in its early stages, with the practical usage and ownership of digital currencies remaining relatively limited.
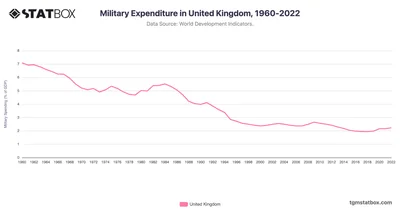
The UK’s defense spending rose to 2.2% in 2020, emphasizing security. Discover more statistics and insights on TGM StatBox.
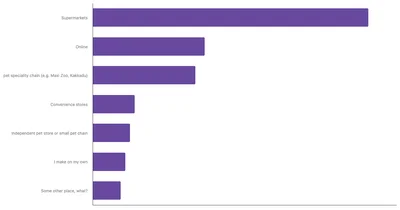
Online platforms are increasingly popular among French pet owners, with 24% choosing to purchase pet food online, reflecting a growing trust in digital shopping for pet essentials.
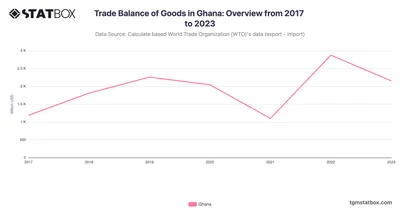
Ghana’s trade balance remained in surplus, peaking in 2022 due to robust gold and cocoa exports. Discover more statistics and insights on TGM StatBox.
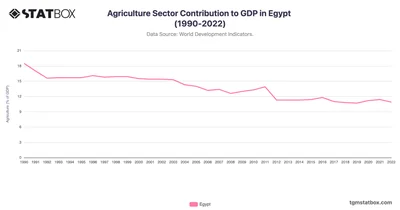
In Egypt, agriculture's GDP contribution declined gradually from 18.5% in 1990 to around 10.9% by 2022. Discover the full Egypt’s agriculture GDP data at TGM StatBox.
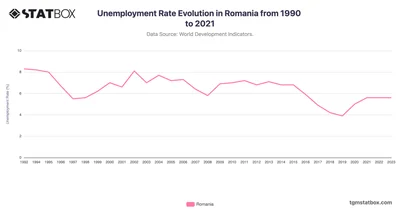
Romania's unemployment rate then gradually declined, reaching 5.8% in 2008 before the global financial crisis caused a rebound to 7% in 2010. Discover more on TGM StatBox.
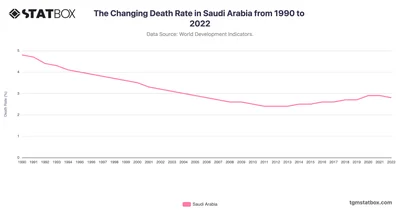
Saudi Arabia’s death rate reflects healthcare advancements and demographic shifts. Discover more statistics and insights on TGM StatBox.
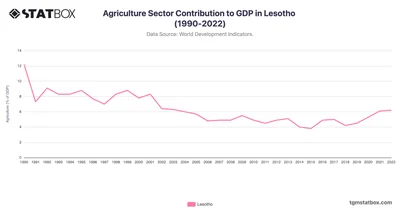
In Lesotho, agriculture's share of GDP declined significantly over the decades, from 12.2% in 1990 to a low of 3.8% in 2015. See full Lesotho’s GDP data at TGM StatBox.
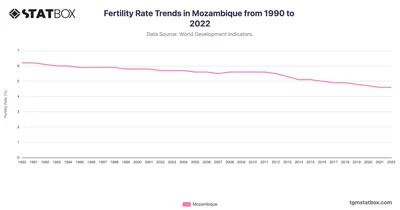
Explore Mozambique's fertility trends from 1990 to 2022, revealing demographic transitions shaped by national development. Discover more statistics and insights on TGM StatBox.
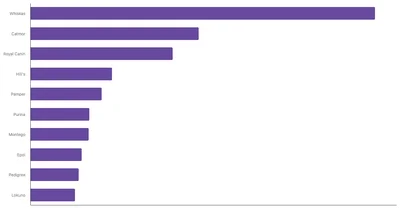
Whiskas stands out as the top recognized cat food brand in South Africa. Following closely are Catmor and Royal Canin, which also hold prominent positions in brand recognition.
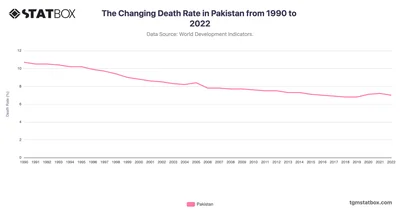
Pakistan’s death rate evolution highlights public health advancements and ongoing challenges. Discover more statistics and insights on TGM StatBox.
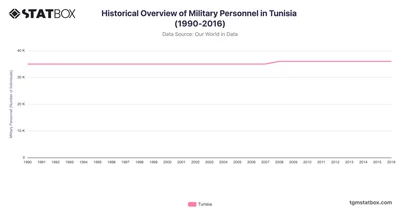
Tunisia’s military personnel remained relatively constant from 1990 to 2016. Discover more Tunisia’s statistics and insights on TGM StatBox.
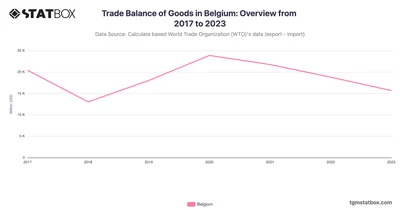
Belgium maintained a positive trade balance, supported by strong exports in chemicals and machinery. Discover more statistics and insights on TGM StatBox.
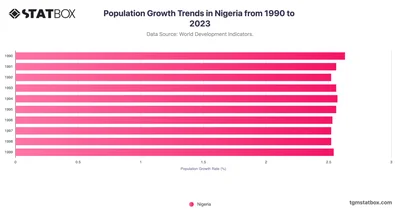
Nigeria’s large population continues to drive significant growth, positioning it as one of the fastest-growing populations globally. See full data of Nigeria’s Population Growth on TGM StatBox.
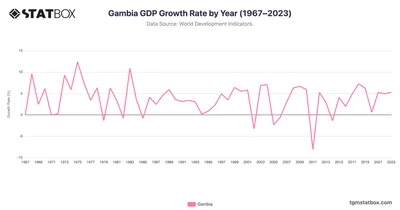
Gambia's resilience is evident as it navigated challenges, including the COVID-19 pandemic, achieving a growth rate of 5.3% in 2023. Read more on TGM StatBox.
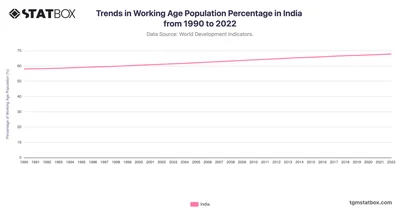
India's working-age population increased from 58% in 1990 to 67.8% in 2022, driven by its young demographic and population growth. Discover more on TGM StatBox.
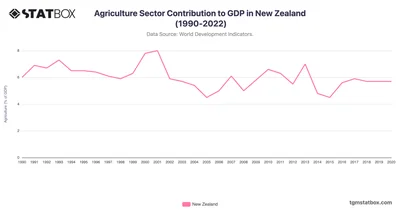
Explore New Zealand’s agriculture GDP role in rural employment and export markets. Discover the full New Zealand’s agriculture GDP data at TGM StatBox.






