Insights library
Not sure where to start? Dive into a diverse selection of charts and data visualizations across topics, and find the information you need to drive your research and analysis.
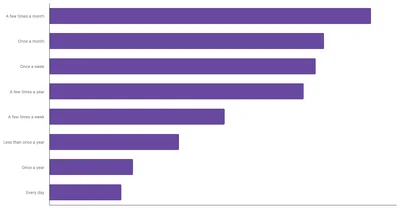

Gambling in the Netherlands is mostly occasional, with 20.38% gambling monthly and just 4.57% daily, suggesting a balanced, recreational approach overall.
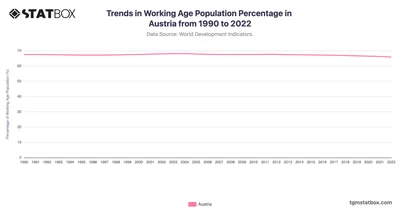
Austria's working-age population percentage displayed stability from 1990 to 2004, hovering around 67.5%. Discover complete data on Austria's working-age population on TGM StatBox.
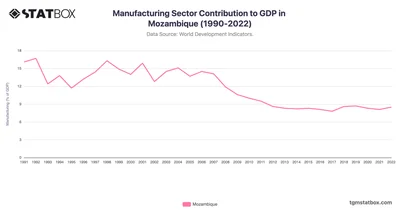
Mozambique's manufacturing contribution to GDP displayed fluctuations from 1991 to 2022, with a peak at 16.7% in 1992. See more Mozambique's GDP data on TGM StatBox.
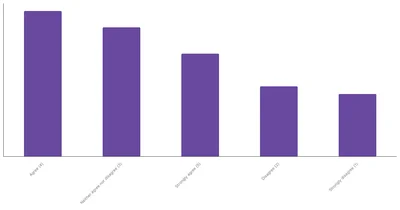
Sports betting has a slightly positive effect on Chileans' interest in sports, with 48.66% agreeing or strongly agreeing that it boosts their engagement.
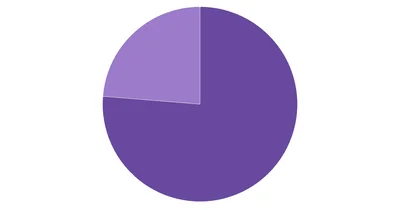
76.28% of respondents primarily bet on sports via the internet or mobile apps, significantly outpacing the 23.72% who favor in-person betting at sportsbooks or casinos.
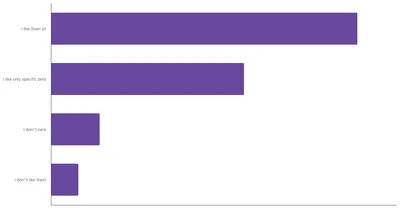
Approximately 53.22% of New Zealanders respondents expressed a fondness for all types of pets, while 33.55% reported preferring only specific pets.
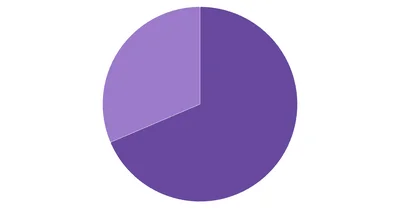
Discover the most preferred betting channels in Romania through TGM Statbox's data, highlighting the platforms that dominate the market.
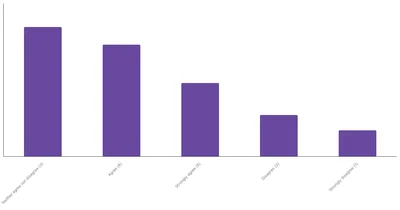
In Argentina, nearly 48% of respondents show interest in engaging with sports betting content, such as through social media or dedicated websites.
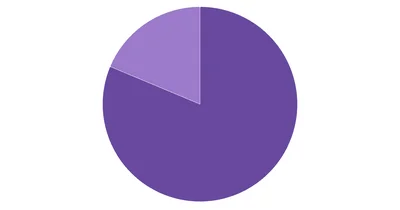
In Colombia, 81.31% of bettors prefer online or mobile app sports betting, while 18.69% still choose in-person wagers at sportsbooks or casinos.
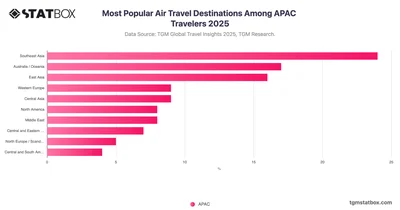
In 2025, Southeast Asia tops air travel destinations in APAC, driven by affordability, regional access, and post-pandemic demand for nearby escapes.
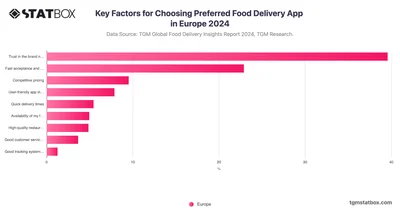
Trust (39.6%) tops the list for Europeans choosing food delivery apps, followed by speed and pricing—fueling loyalty to brands like Glovo and Uber Eats.
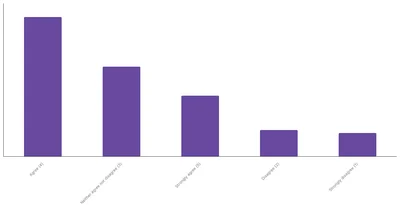
In Australia, there is a notable interest in live sports betting, with 58.92% of people favoring betting on sports in real-time while watching.
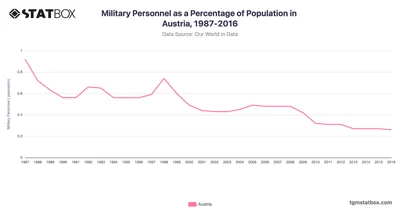
Austria’s military personnel as a percentage of population dropped from 0.9% in 1987 to 0.3% by 2016. Discover data on Austria’s military personnel share on TGM StatBox.
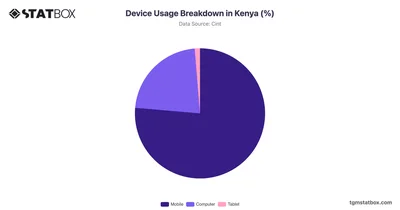
The 22.33% computer usage in Kenya suggests that many users may rely on mobile devices for most of their online activities. Discover more about device usage on TGM StatBox.
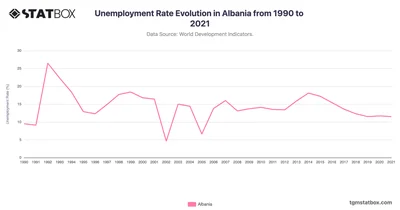
Albania’s unemployment rate saw significant shifts from 1990 to 2021, influenced by economic transition and instability. Discover more data on TGM StatBox.
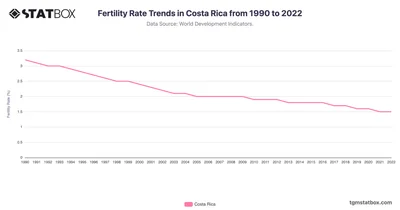
Examine Costa Rica’s fertility trends from 1990 to 2022, reflecting population dynamics and economic developments. Discover more statistics and insights on TGM StatBox.
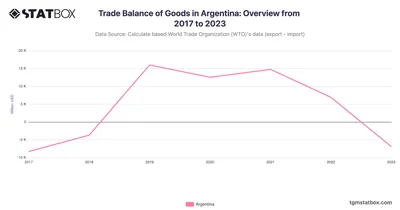
Argentina’s trade surplus in 2019 turned into a deficit in 2023, reflecting economic challenges and export disruptions. Discover more statistics and insights on TGM StatBox.
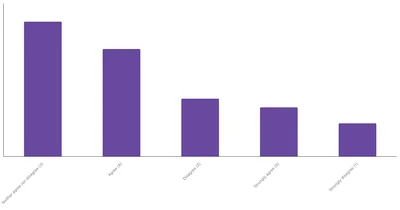
Explore engagement with sports betting content in Serbia with TGM Statbox Charts. Discover insights into how Serbians consume news, odds, and analysis related to sports wagering.
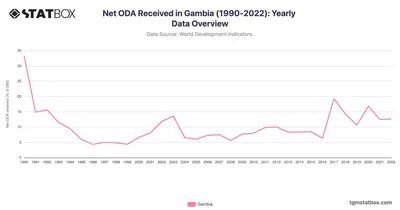
The Gambia’s Net ODA peaked at 33.4% in 1990, dropping to 12.6% in 2022 amid economic reforms. Discover more insights on TGM StatBox.
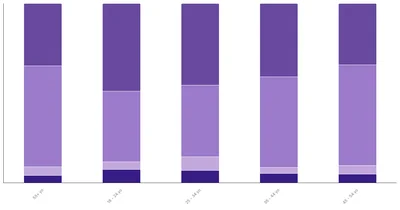
Younger Peruvians (18-24) show the highest general liking for all pets at 48.95%, while the preference for specific pets increases with age.
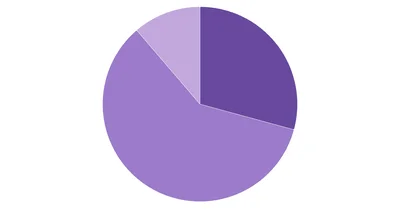
Almost 60% of Colombian respondents have not used or owned cryptocurrency implies a significant barrier to entry—whether it's lack of trust, understanding, or infrastructure.
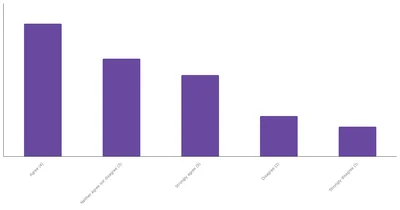
A large portion of the global audience (56%) enjoys engaging with sports betting content on platforms like social media or websites.
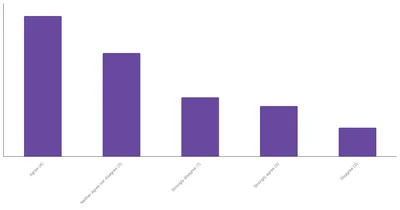
Engagement with Sports Betting Content in Poland | TGM Statbox Chart: Explore the level of engagement with sports betting content in Poland through TGM Statbox.
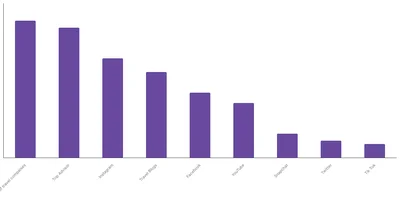
Italian travelers primarily use travel company websites to learn about new destinations, with 40% of respondents favoring this source.
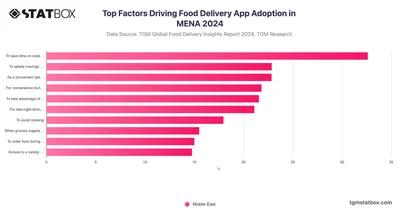
In MENA, food delivery apps serve both daily needs and lifestyle habits—saving time, easing busy days, satisfying cravings, and offering variety and comfort.
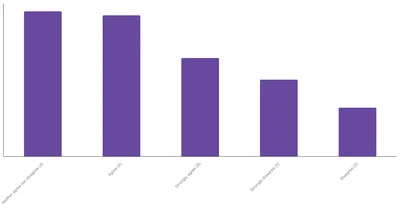
Understand how sports interest is influenced by betting activities in the USA, with detailed data on sports preferences and betting behaviors.
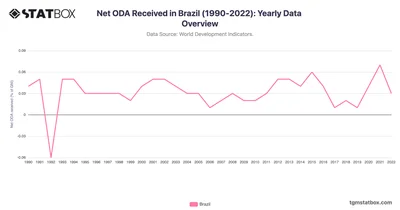
Brazil’s Net ODA has remained under 0.1% due to robust revenue and development, reflecting its shift to South-South cooperation. Discover more statistics and insights on TGM StatBox.
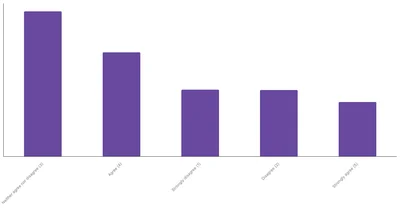
In the Netherlands, 36.3% of respondents either agree or strongly agree that they enjoy consuming content related to sports betting, such as on social media or websites.
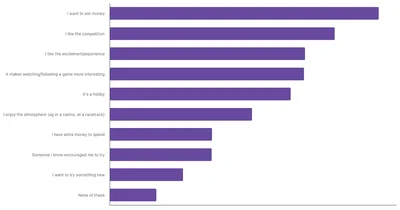
In France, the primary motivation for sports betting is the desire to win money, cited by 39.4% of participants. 32.96% also engage in betting for the enjoyment of competition.
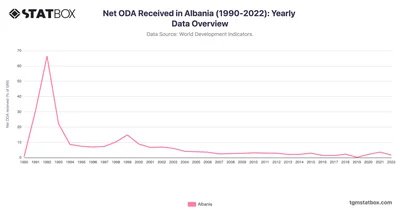
Albania’s Net ODA peaked at 66.4% in 1992 during its transition from communism, stabilizing after 2010 as economic growth reduced aid dependency. Discover more statistics and insights on TGM StatBox.






