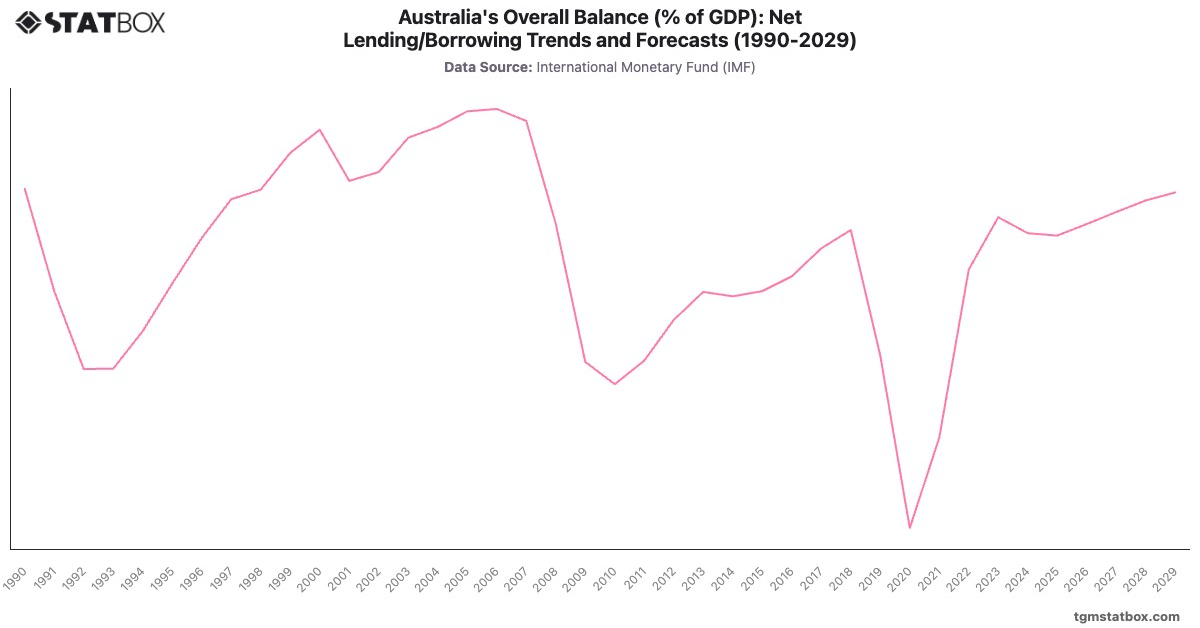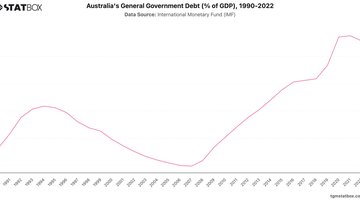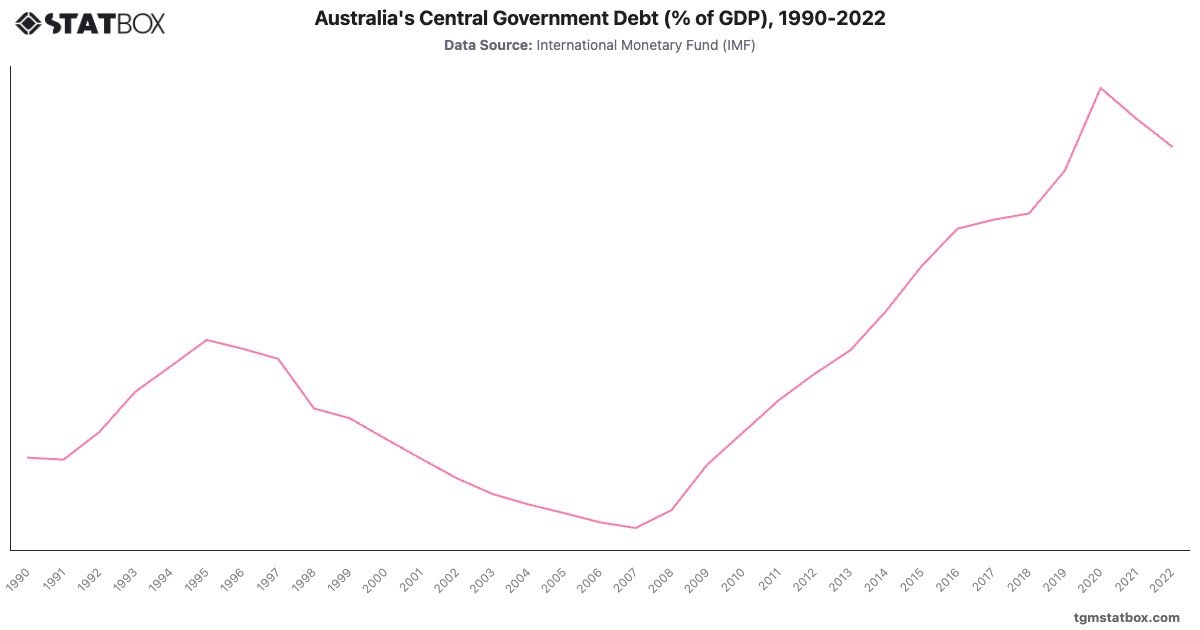
Australia's government debt remained relatively low through the 1990s, peaking at in 1995 before declining to a low of in 2007, supported by strong economic growth and fiscal surpluses. The global financial crisis reversed this trend, with debt rising to in 2010 as the government implemented stimulus measures.
The debt burden grew steadily, reaching in 2020 as COVID-19 necessitated large-scale borrowing. A modest recovery reduced it to by 2022, reflecting economic resilience and efforts to stabilize public finances.
The debt burden grew steadily, reaching in 2020 as COVID-19 necessitated large-scale borrowing. A modest recovery reduced it to by 2022, reflecting economic resilience and efforts to stabilize public finances.
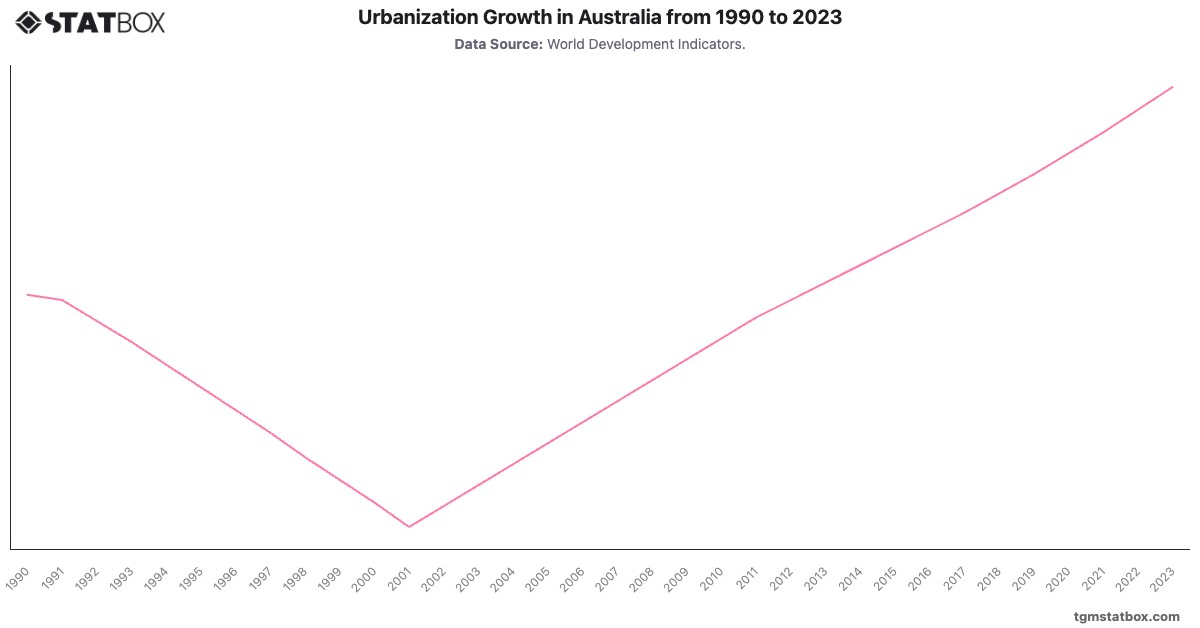
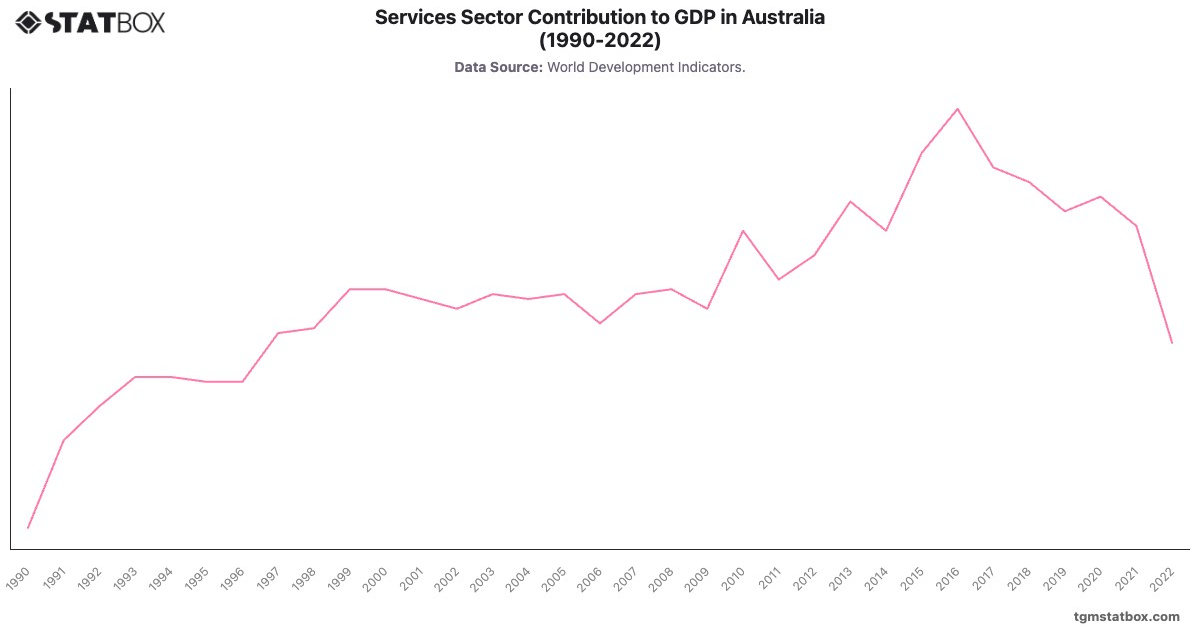
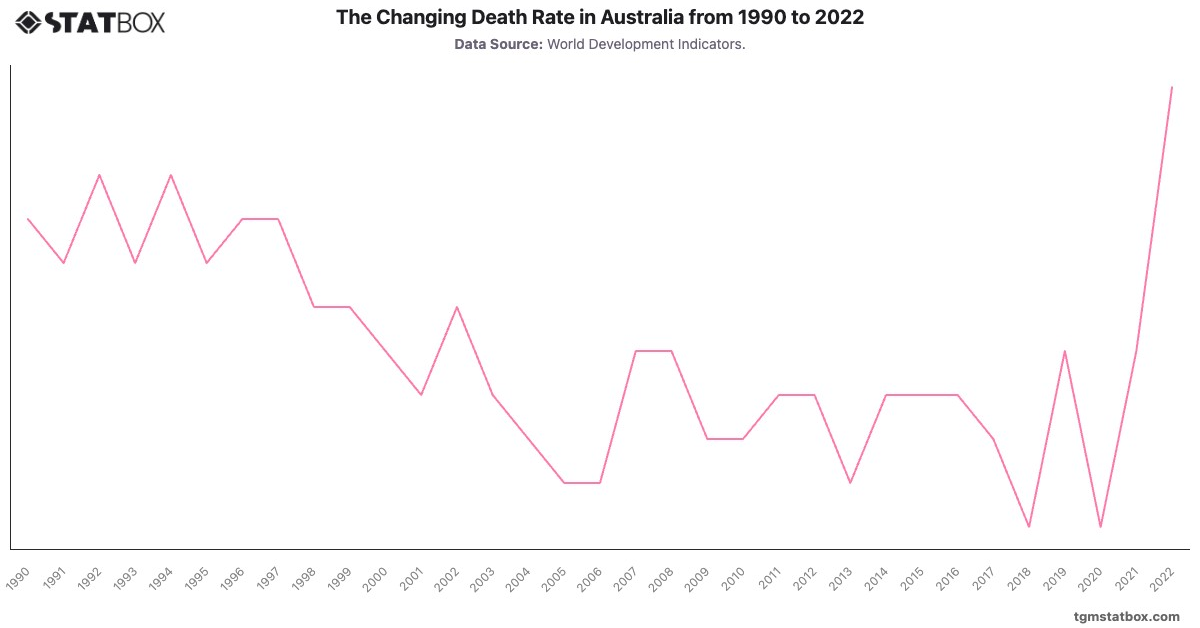
Gain a broader perspective by reviewing Australia’s urban population growth, Australia’s service sector share in GDP, Australia’s death rate changes.