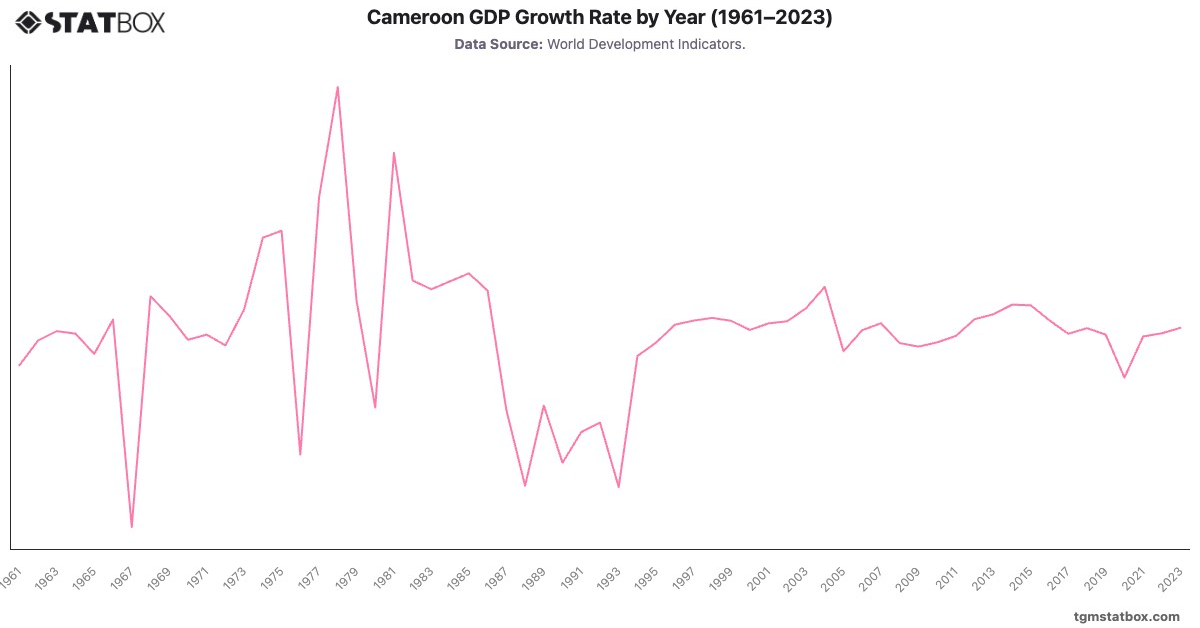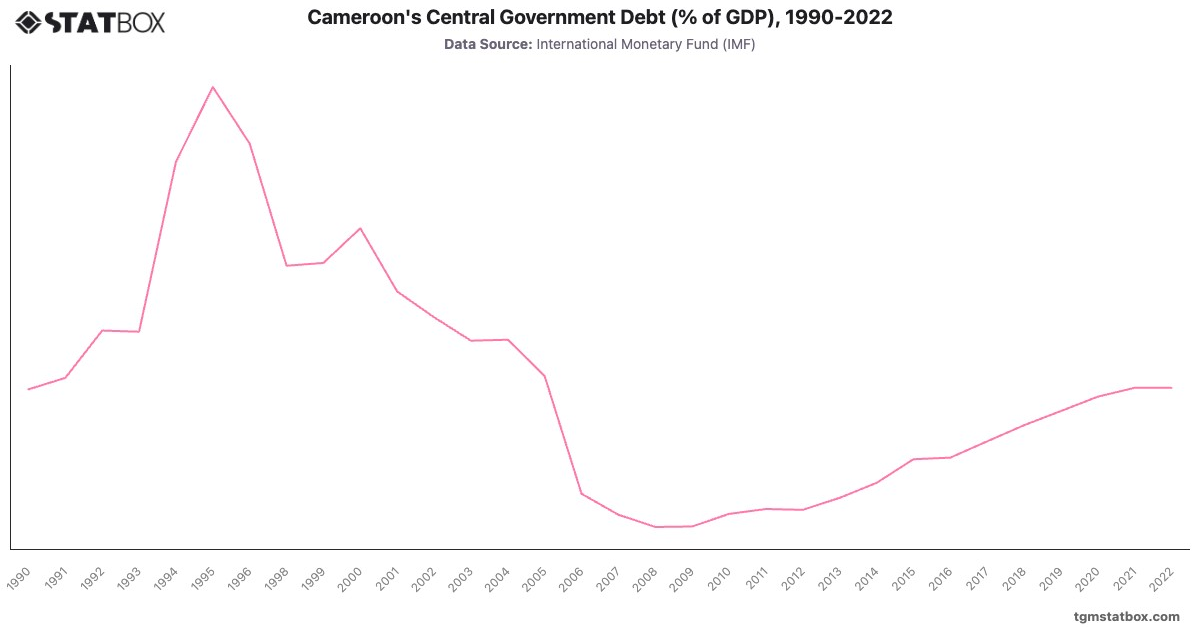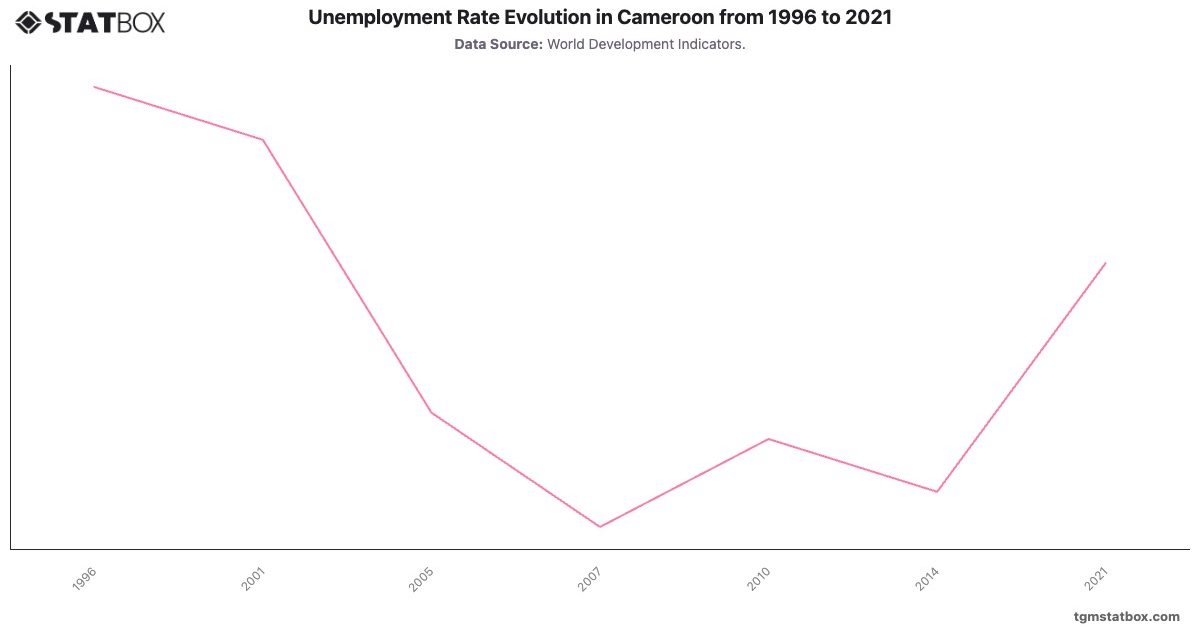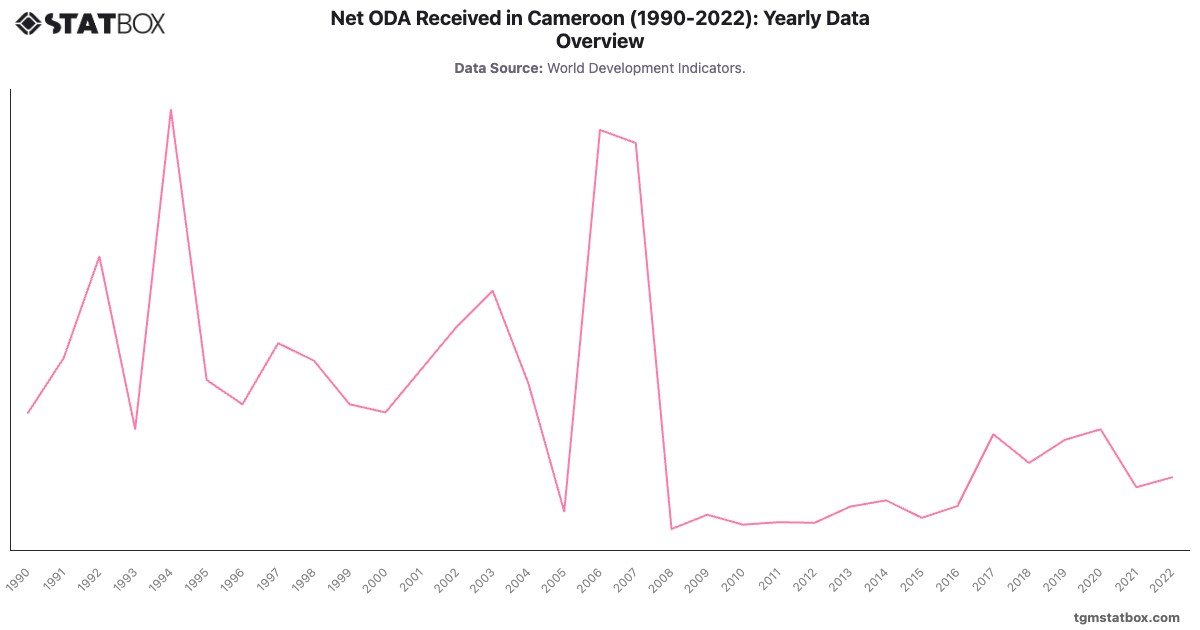
Cameroon’s Net ODA as a percentage of GNI fluctuated throughout the observed period, reflecting its economic challenges and external debt relief efforts. Peaks in 1994 () and 2006-2007 ( and ) align with international debt relief initiatives under the Heavily Indebted Poor Countries (HIPC) program.
Post-2010, Net ODA stabilized around 2-, driven by targeted development assistance in health, education, and conflict management. The slight decline in the 2020s reflects Cameroon’s gradual progress toward economic self-reliance despite ongoing challenges related to internal conflicts and regional instability.
Post-2010, Net ODA stabilized around 2-, driven by targeted development assistance in health, education, and conflict management. The slight decline in the 2020s reflects Cameroon’s gradual progress toward economic self-reliance despite ongoing challenges related to internal conflicts and regional instability.
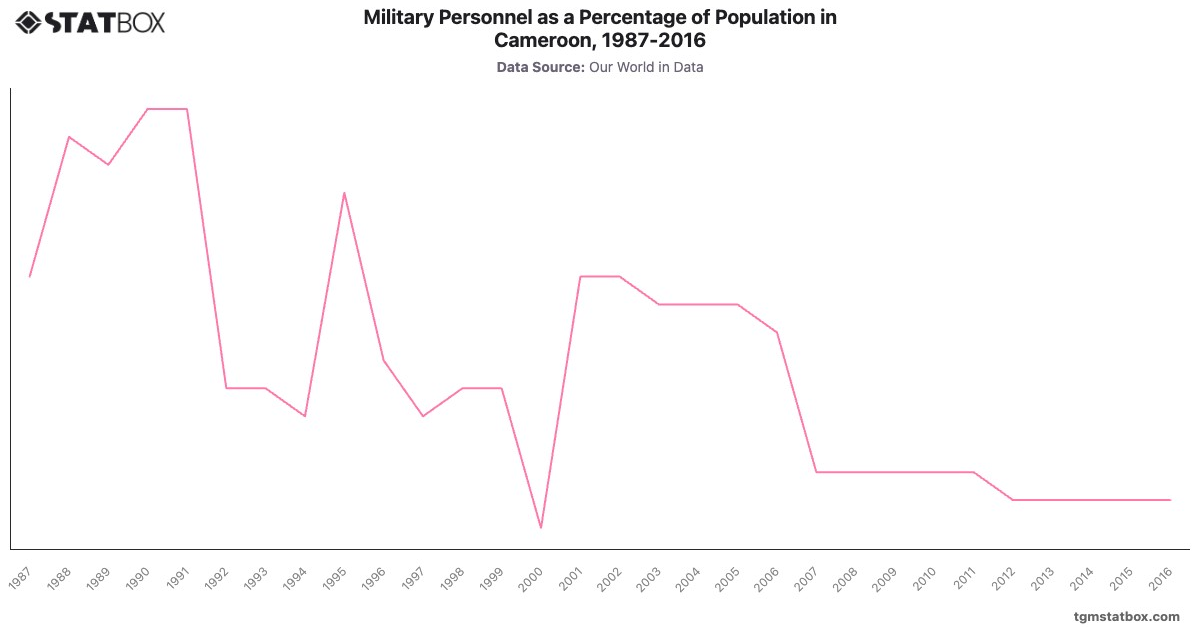
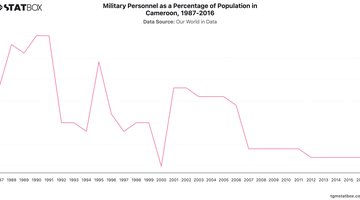
For a broader context, visit other statistics on Cameroon’s agriculture GDP contribution, Cameroon’s import metrics, Cameroon’s military personnel ratio.