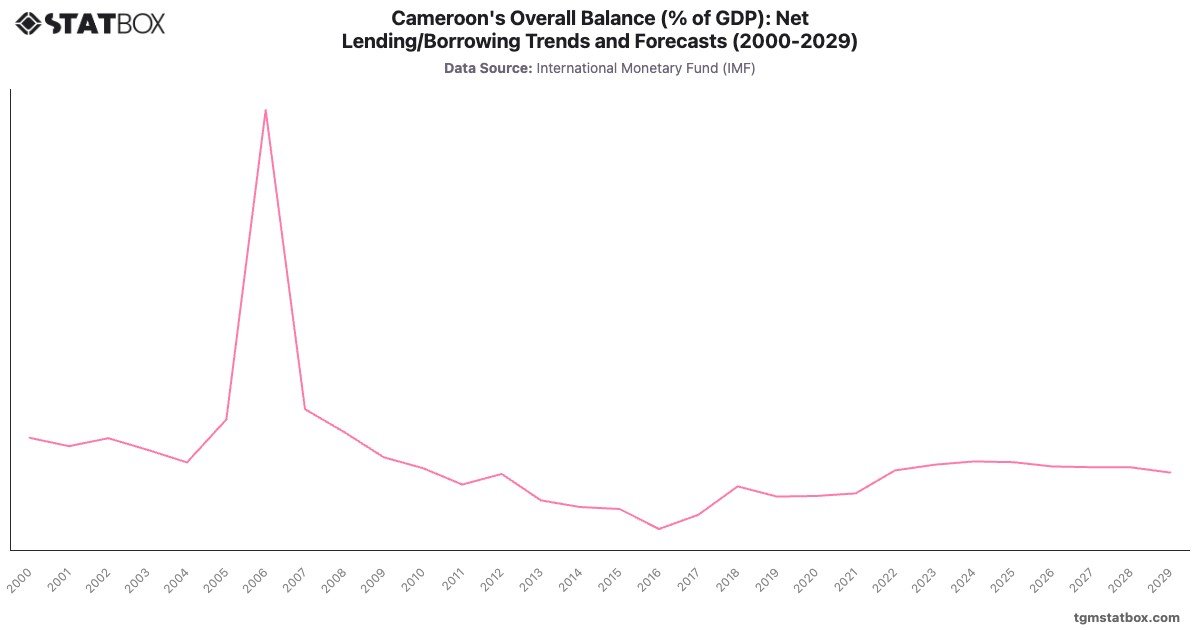
Cameroon’s fiscal performance has been shaped by oil revenues and public investment cycles. The early 2000s saw surpluses, peaking at of GDP in 2006, driven by high oil prices and debt relief initiatives. However, declining oil revenues and rising public expenditure led to persistent deficits from 2010 onwards, averaging - in the 2010s.
The COVID-19 pandemic had a modest impact on Cameroon’s fiscal balance, with deficits remaining steady at - in 2020. Projections for 2029 indicate a slight narrowing to -, reflecting gradual fiscal consolidation efforts and a focus on diversifying the economy beyond oil.
The COVID-19 pandemic had a modest impact on Cameroon’s fiscal balance, with deficits remaining steady at - in 2020. Projections for 2029 indicate a slight narrowing to -, reflecting gradual fiscal consolidation efforts and a focus on diversifying the economy beyond oil.
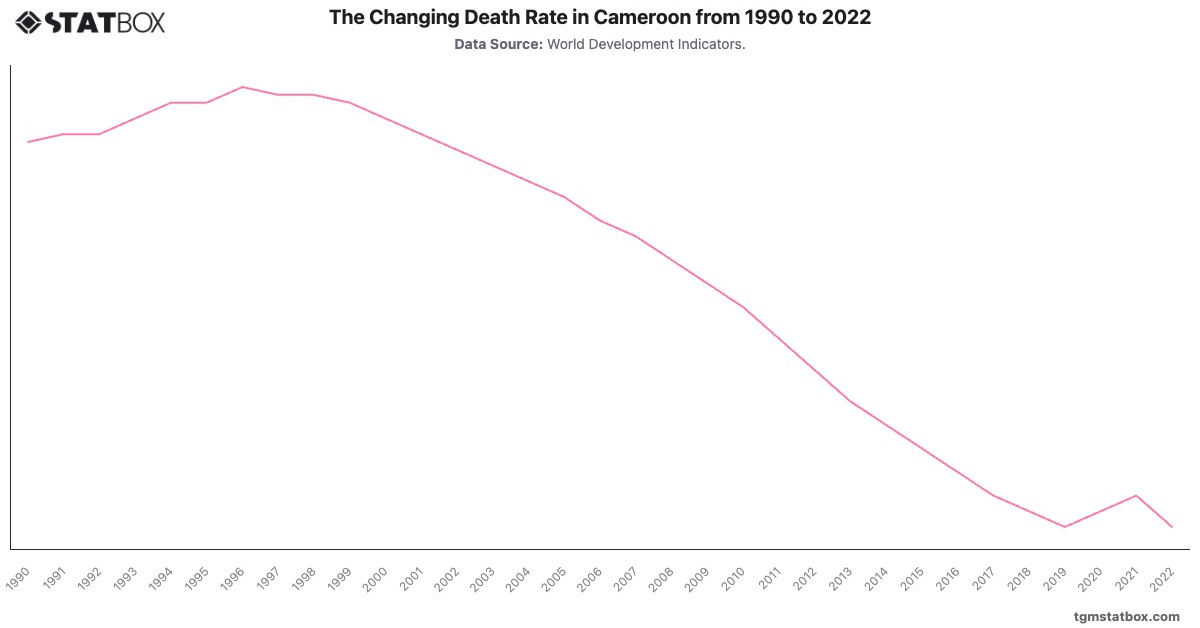
Gain a broader perspective by reviewing Cameroon’s defense spending, Cameroon’s mortality rate, Industry sector’s share in cameroon’s GDP.