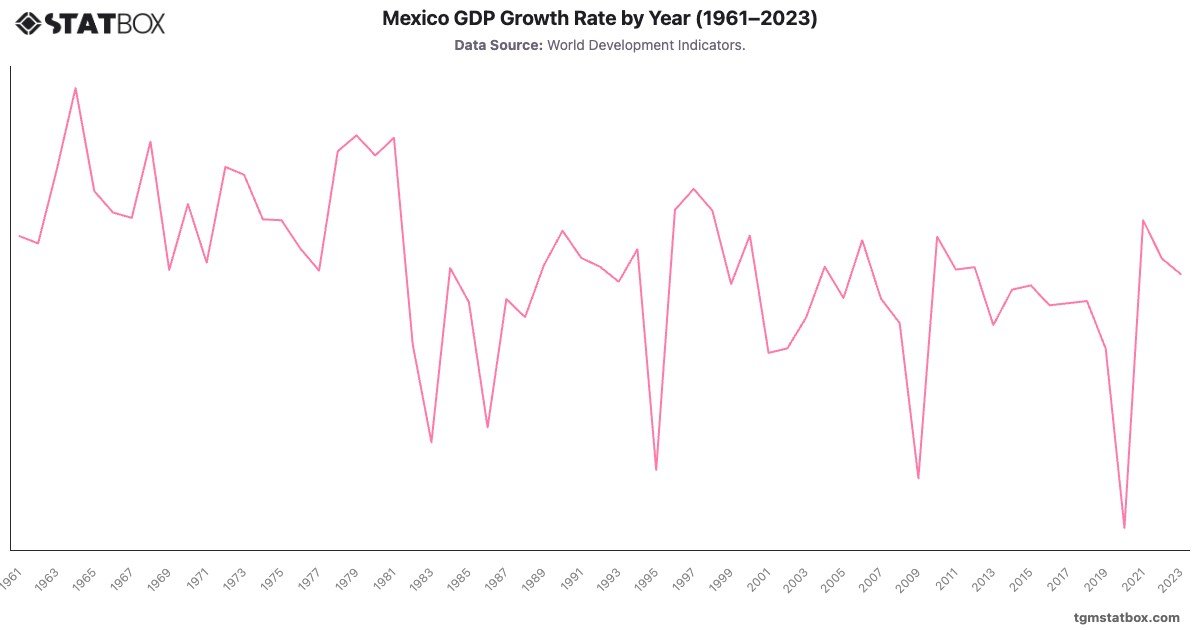
Mexico GDP Growth Rate by Year (1961–2023)

Mexico GDP Growth Rate by Year (1961–2023)

Unlock this statistic

Log in to unlock

No account? Sign up free

Insights

Key Takeaways

Mexico GDP Growth Rate (1961-2023)

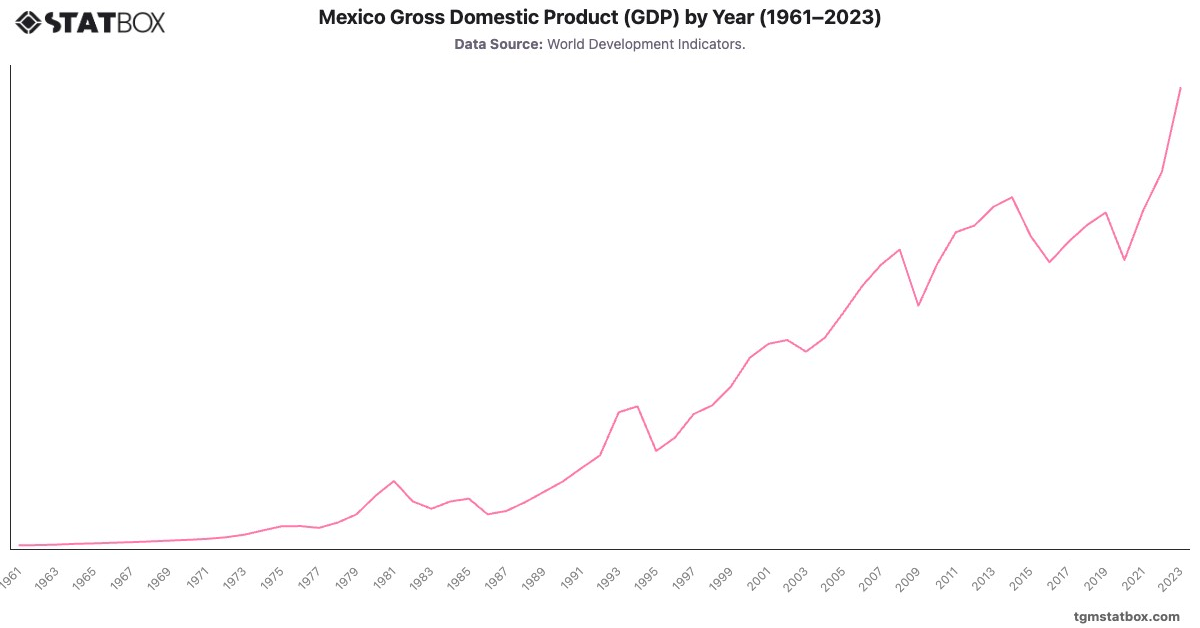
Mexico’s economic growth from 1961 showcases both resilience and vulnerability. The 1960s and 1970s saw rapid industrialization, reaching in 1964. However, the debt crisis of the 1980s led to contractions, and growth remained volatile. The 2008 financial crisis caused a steep decline, but the economy rebounded, reaching in 2010. The pandemic induced a sharp contraction in 2020, but by 2023, growth had stabilized around , driven by manufacturing and exports.

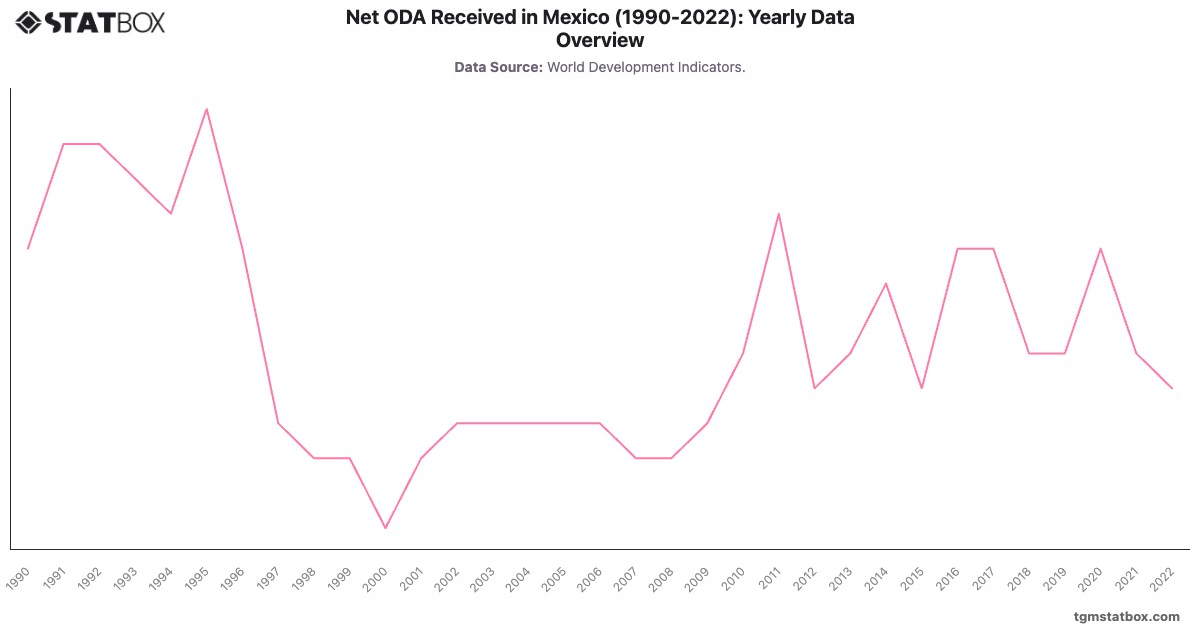
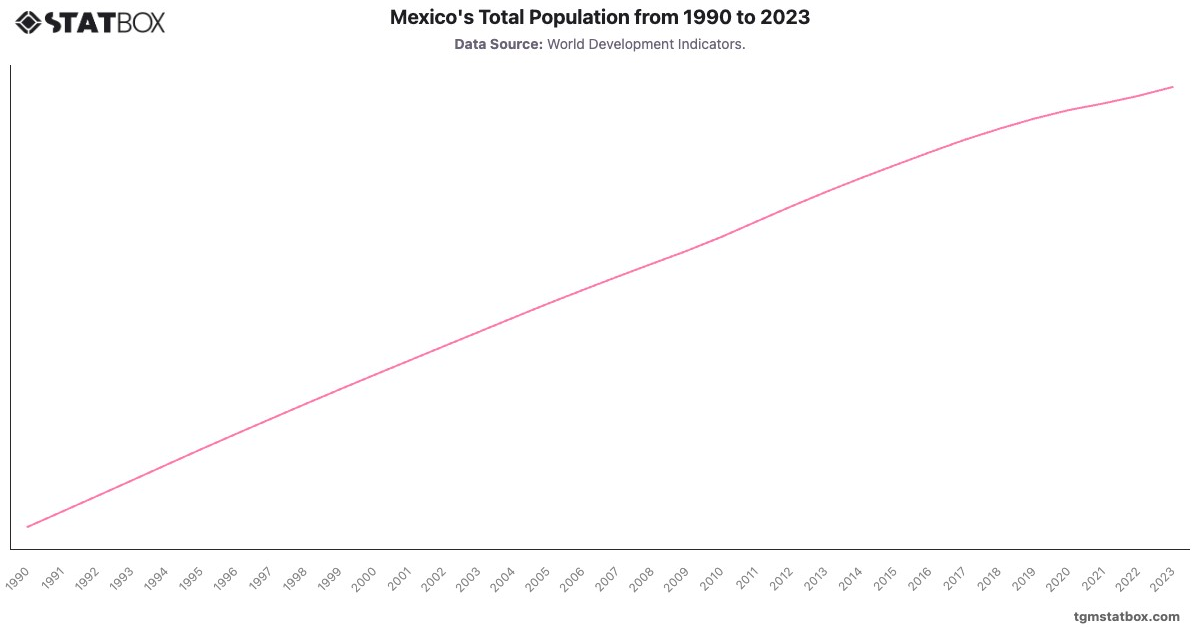
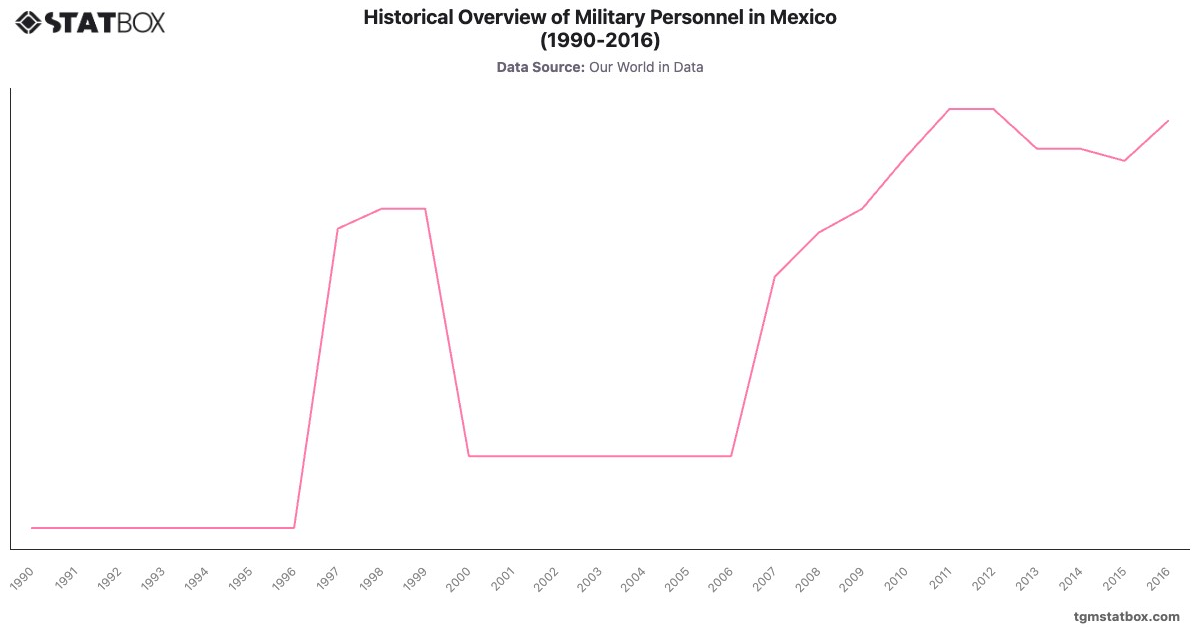
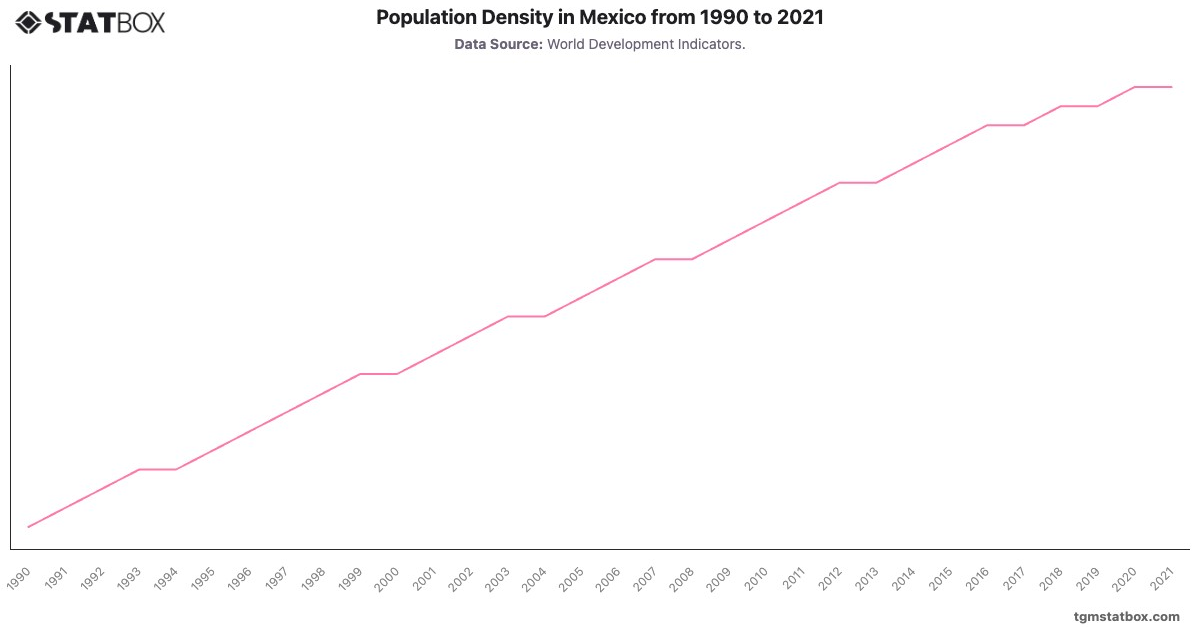
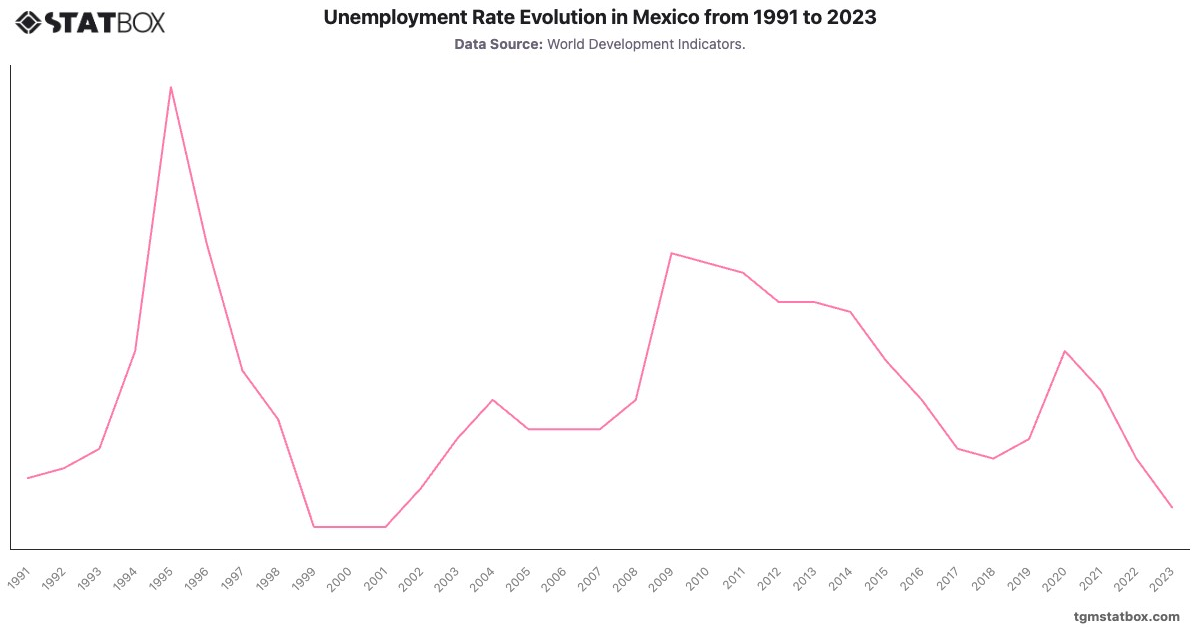
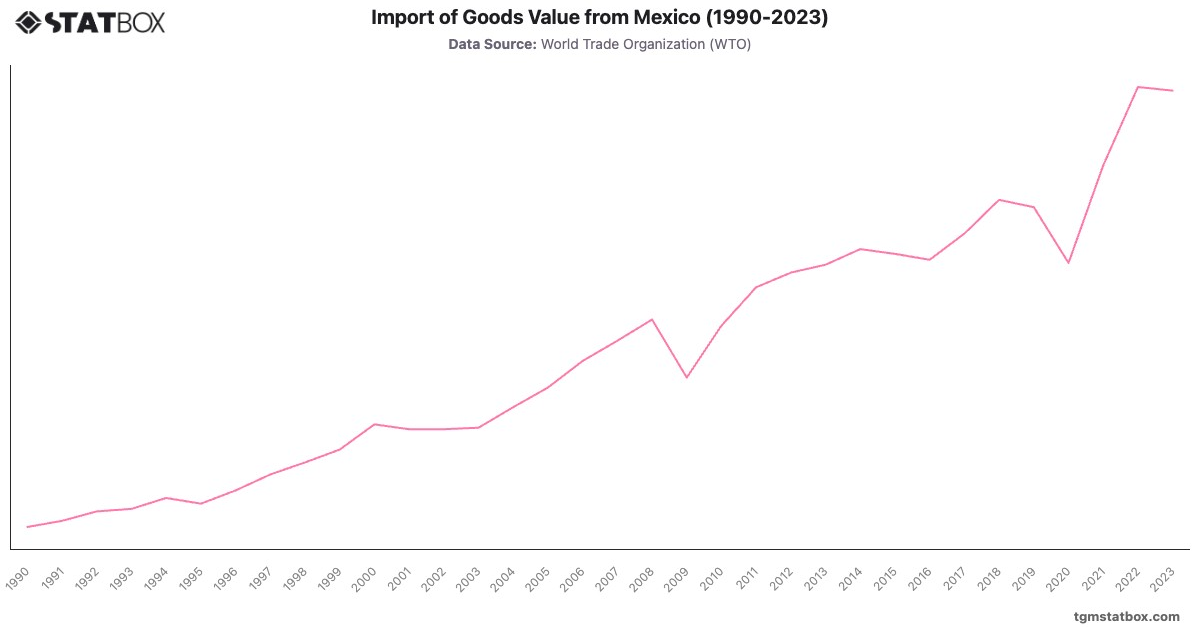
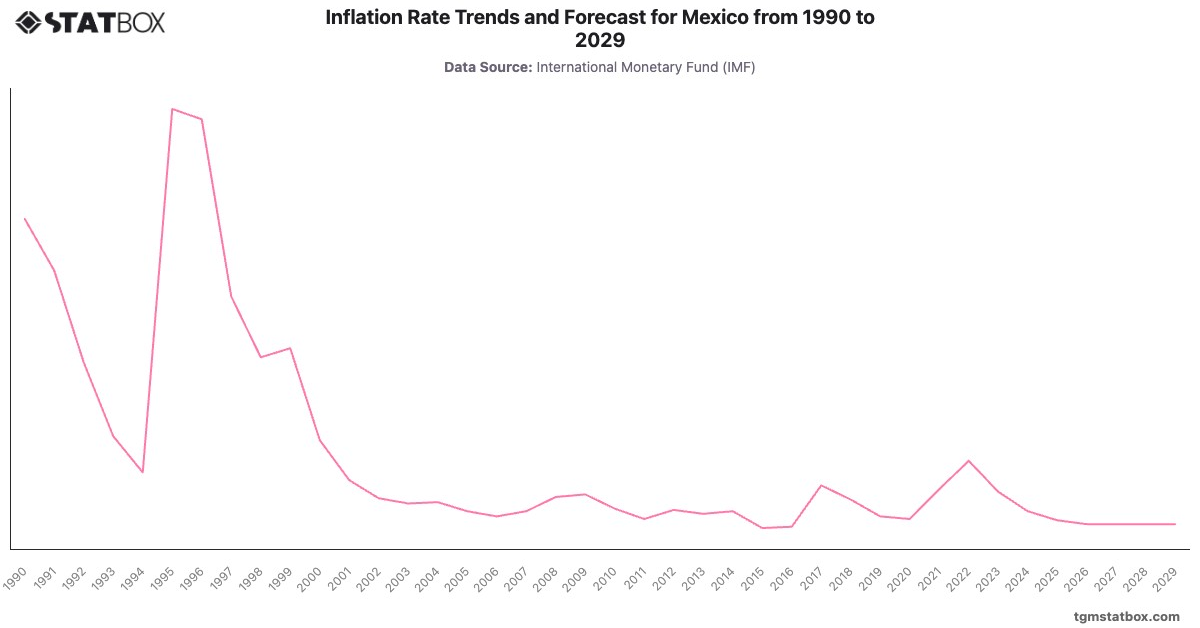
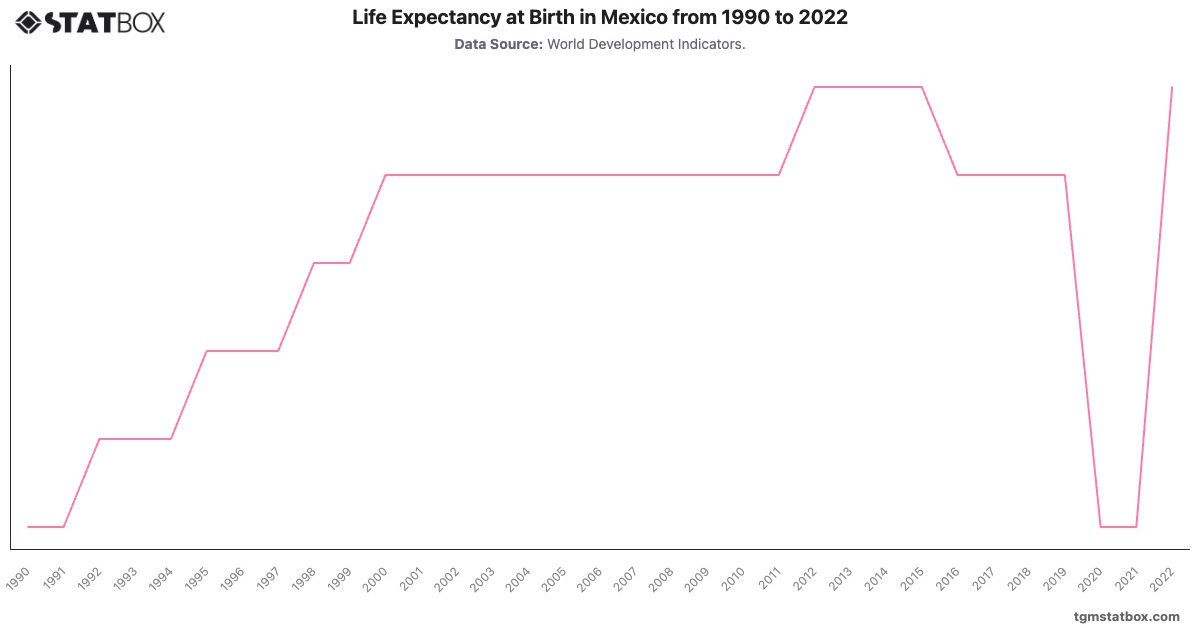
Explore related charts to gain a better understanding of Mexico’s military personnel proportion, Mexico’s population density, Mexico’s unemployment rate trends.

Would you like to know more?
Check our report on this topic

Sustainability Report: Insights in Mexico

Mexico Sustainability Insights Report 2024

Sustainability Report: Insights in Mexico

Explore the latest Mexico insights on sustainability with TGM’s 2024 report series. Access data on behaviors, challenges, and motivations across 30+ markets.

Go to report

Further Recommended Statistics

Statbox vector
Statbox |form contact icon

Have Other Queries?

Statbox vector

Connect with our expert team for immediate assistance or comprehensive market analysis. We are always ready to support your business needs.