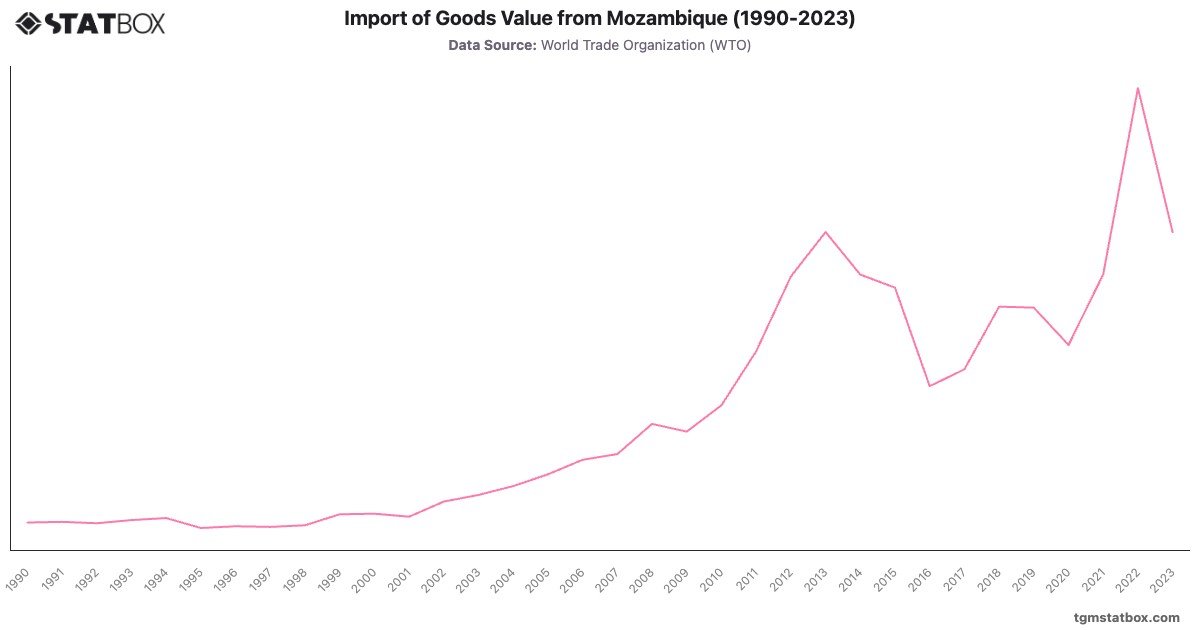
Mozambique’s imports increased from $878M in 1990 to $14.7B in 2022, reflecting its economic development and investments in infrastructure. Growth accelerated between 2003 and 2013, with imports rising from $1.7B to $10.1B due to energy and transport projects.
After a contraction during the mid-2010s, imports rebounded post-pandemic, peaking at $14.7B in 2022. The 2023 decline to $10.1B reflects global economic adjustments. Mozambique’s trade trends highlight its reliance on imports for industrialization and its vulnerability to external shocks.
After a contraction during the mid-2010s, imports rebounded post-pandemic, peaking at $14.7B in 2022. The 2023 decline to $10.1B reflects global economic adjustments. Mozambique’s trade trends highlight its reliance on imports for industrialization and its vulnerability to external shocks.
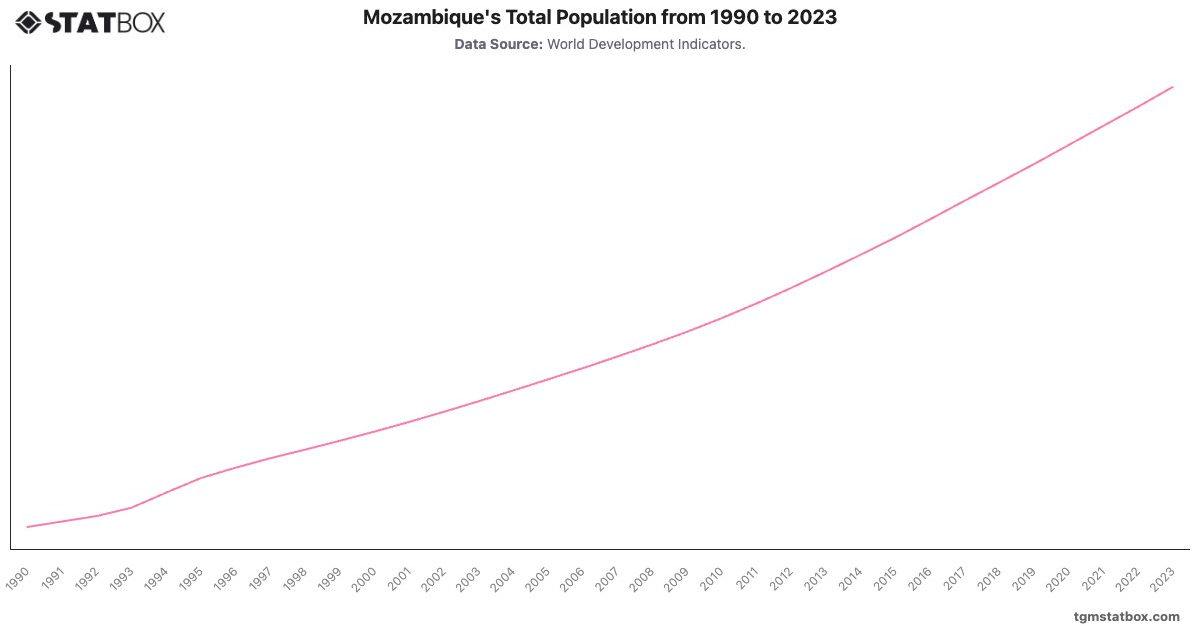
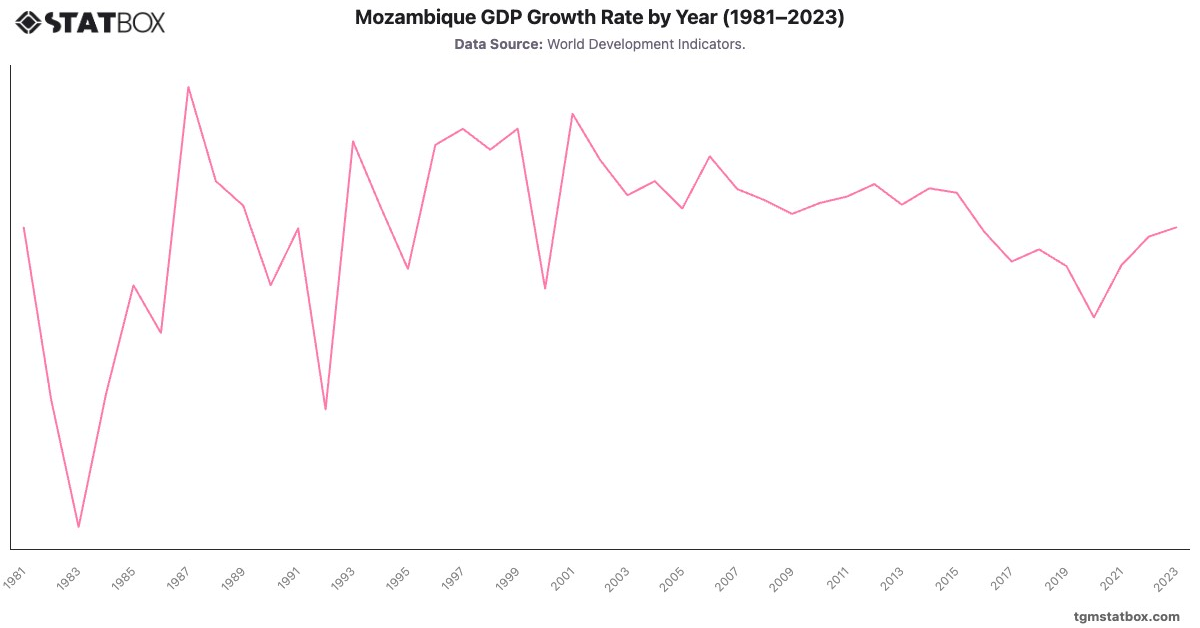
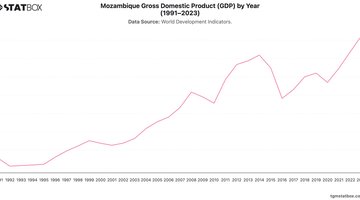
Explore related charts to gain a better understanding of Mozambique’s yearly GDP growth rate, Mozambique’s net ODA received overview, Mozambique’s population growth.