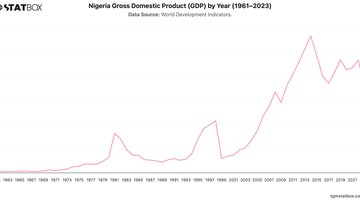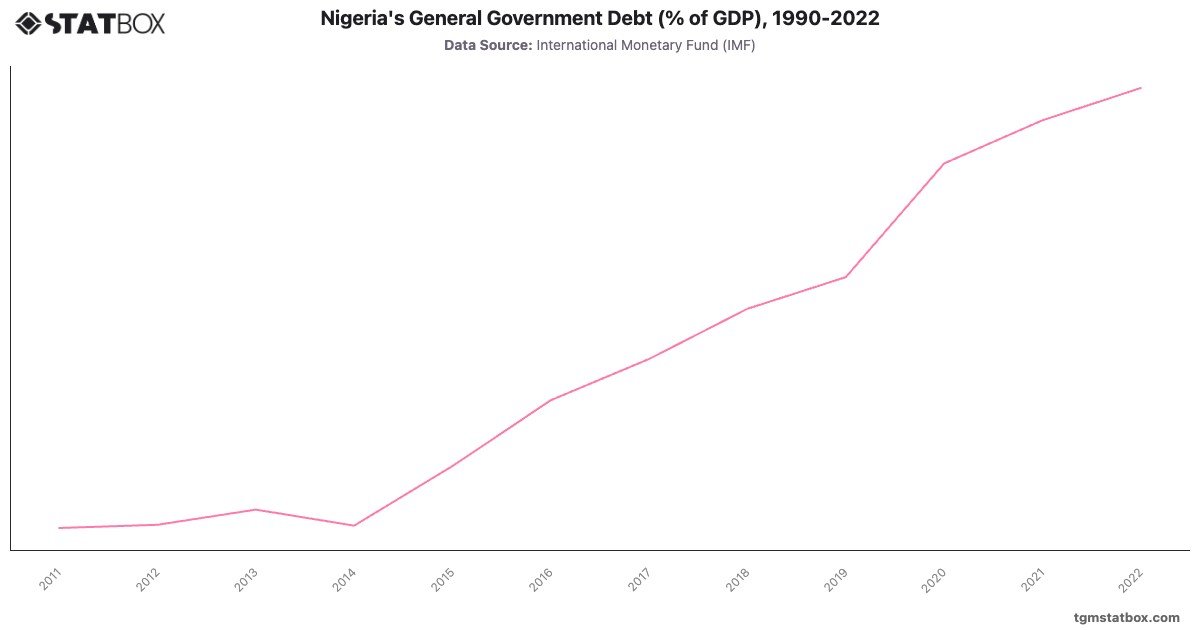
Nigeria's debt-to-GDP ratio exhibited a steady increase from 2011 to 2022. Starting at in 2011, the ratio rose gradually due to various economic factors, including lower oil revenues and increased borrowing to fund infrastructural projects. In 2015, the ratio reached , reflecting Nigeria’s efforts to stimulate economic growth through fiscal expansion amid declining oil prices that negatively impacted revenues.
The trend of rising debt continued, with significant increases seen post-2016 when the debt-to-GDP ratio grew to and later in 2018. This rise was partly due to external debt accumulation as Nigeria sought to diversify its economy and address fiscal deficits. By 2022, Nigeria’s debt ratio peaked at , reflecting continued borrowing as the government tackled economic challenges exacerbated by the COVID-19 pandemic and persistent inflationary pressures.
The trend of rising debt continued, with significant increases seen post-2016 when the debt-to-GDP ratio grew to and later in 2018. This rise was partly due to external debt accumulation as Nigeria sought to diversify its economy and address fiscal deficits. By 2022, Nigeria’s debt ratio peaked at , reflecting continued borrowing as the government tackled economic challenges exacerbated by the COVID-19 pandemic and persistent inflationary pressures.
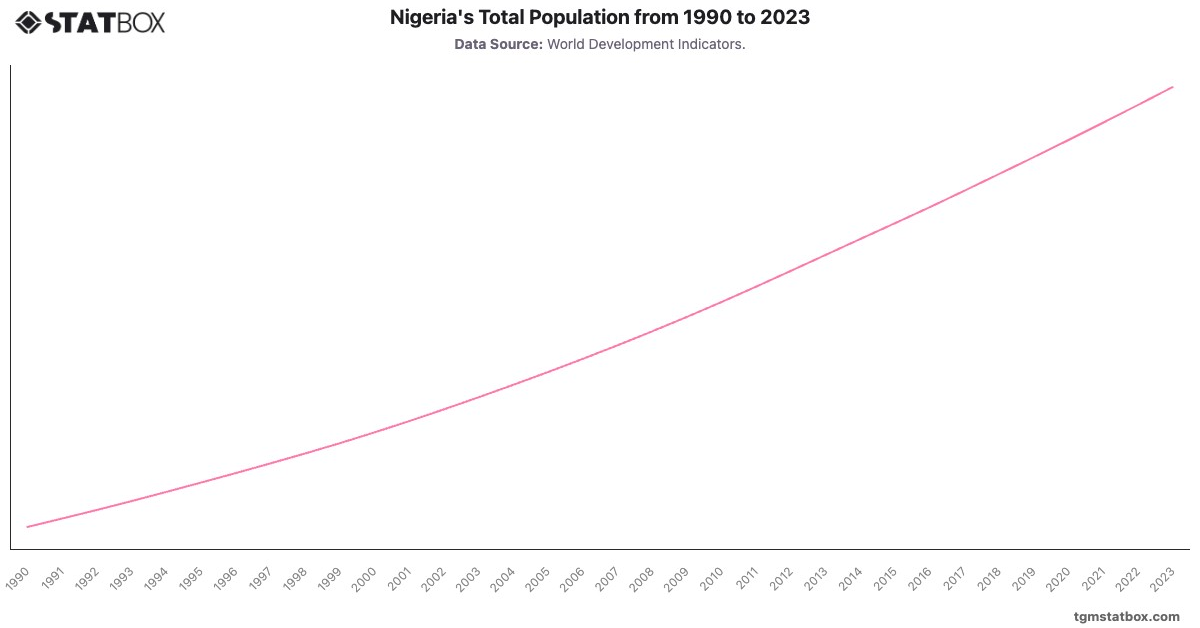
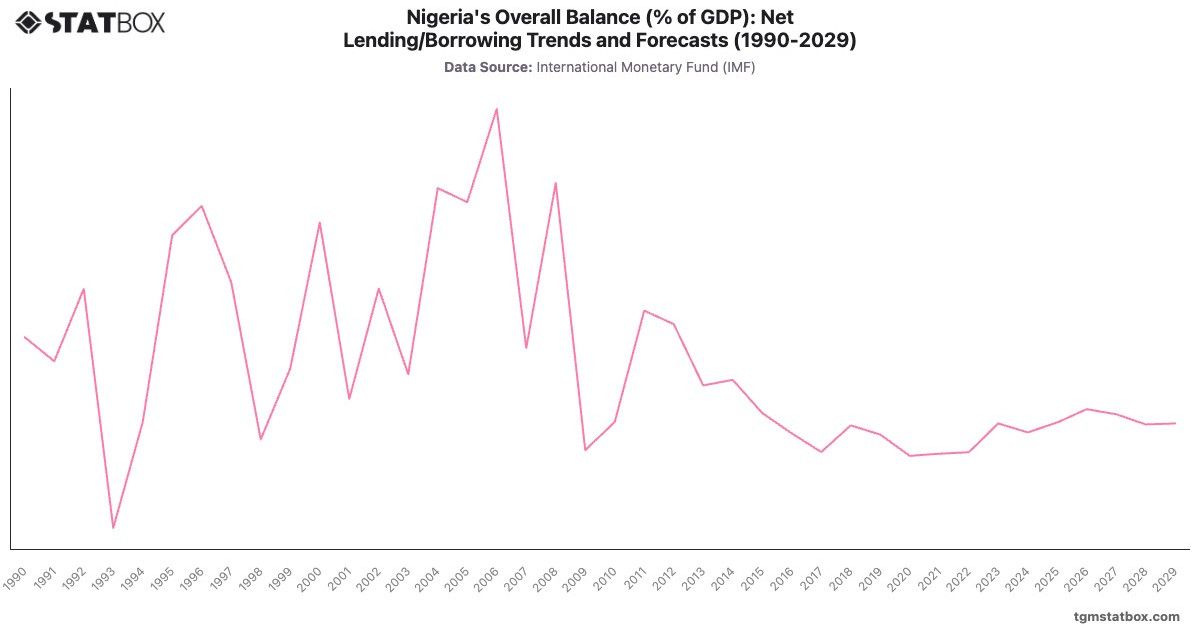
Discover additional trends and data on Nigeria’s population numbers, Nigeria’s net lending/borrowing (% of GDP), Nigeria’s central government debt percentage.